There are some pictures that may give a lot of information about a semigroup. This is the case of the egg-box picture of the D-classes, the right Cayley graph of a finite monoid and the Schützenberger graphs of a finite inverse monoid.
‣ DrawDClassOfElement( arg ) | ( function ) |
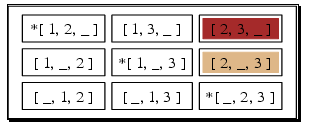
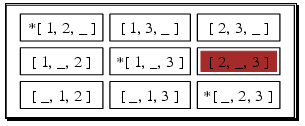
This function uses DotForDrawingDClassOfElement (3.1-2) to compute the dot code to produce the image that is then displayed. It takes as arguments a semigroup followed by a transformation which is the element whose D-class will be drawn. Optionally we can then specify n lists of elements and the elements of each list will be drawn in different colours. Finally, if the last argument is the integer 1 then the elements will appear as transformations, otherwise they will appear as words. The idempotents will be marked with a * before them.
This last optional argument may also be the integer 2 and in this case the elements will appear as integers, where i represents the element Elements(S)[i].
gap> DrawDClassOfElement(poi3, Transformation([1,4,3,4]));
gap> DrawDClassOfElement(poi3, Transformation([1,4,3,4]),1);
gap> DrawDClassOfElement(poi3, Transformation([1,4,3,4]),
 [Transformation( [ 2, 3, 4, 4 ] )],1);
gap> DrawDClassOfElement(poi3, Transformation([1,4,3,4]),
 [Transformation( [ 2, 3, 4, 4 ] ), Transformation( [ 2, 4, 3, 4 ] )],
 [Transformation( [ 2, 4, 3, 4 ] )],1);
gap> DrawDClassOfElement(poi3, Transformation([1,4,3,4]),
 [Transformation( [ 2, 4, 3, 4 ] )],"Dclass",1);
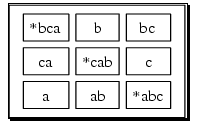
This is the image produced by the first command in the previous example:

‣ DotForDrawingDClassOfElement( arg ) | ( function ) |
This function computes the dot code that can be used to produce a drawing for the D-class of an element of a semigroup. This can be done by using the function DrawDClassOfElement (3.1-1) (if the system is properly configured) or by the user in some independent way. The arguments and options are the same than those of DrawDClassOfElement (3.1-1).
      gap> DotForDrawingDClassOfElement(poi3,Transformation([1,4,3,4]));
"digraph  DClassOfElement {\ngraph [center=yes,ordering=out];\nnode [shape=pla\
intext];\nedge [color=cornflowerblue,arrowhead=none];\n1 [label=<\n<TABLE BORD\
ER=\"0\" CELLBORDER=\"0\" CELLPADDING=\"0\" CELLSPACING=\"0\" PORT=\"1\">\n<TR\
><TD BORDER=\"0\"><TABLE CELLSPACING=\"0\"><TR><TD BGCOLOR=\"white\" BORDER=\"\
0\">*abc</TD></TR>\n</TABLE></TD><TD BORDER=\"0\"><TABLE CELLSPACING=\"0\"><TR\
><TD BGCOLOR=\"white\" BORDER=\"0\">a</TD></TR>\n</TABLE></TD><TD BORDER=\"0\"\
><TABLE CELLSPACING=\"0\"><TR><TD BGCOLOR=\"white\" BORDER=\"0\">ab</TD></TR>\
\n</TABLE></TD></TR>\n<TR><TD BORDER=\"0\"><TABLE CELLSPACING=\"0\"><TR><TD BG\
COLOR=\"white\" BORDER=\"0\">bc</TD></TR>\n</TABLE></TD><TD BORDER=\"0\"><TABL\
E CELLSPACING=\"0\"><TR><TD BGCOLOR=\"white\" BORDER=\"0\">*bca</TD></TR>\n</T\
ABLE></TD><TD BORDER=\"0\"><TABLE CELLSPACING=\"0\"><TR><TD BGCOLOR=\"white\" \
BORDER=\"0\">b</TD></TR>\n</TABLE></TD></TR>\n<TR><TD BORDER=\"0\"><TABLE CELL\
SPACING=\"0\"><TR><TD BGCOLOR=\"white\" BORDER=\"0\">c</TD></TR>\n</TABLE></TD\
><TD BORDER=\"0\"><TABLE CELLSPACING=\"0\"><TR><TD BGCOLOR=\"white\" BORDER=\"\
0\">ca</TD></TR>\n</TABLE></TD><TD BORDER=\"0\"><TABLE CELLSPACING=\"0\"><TR><\
TD BGCOLOR=\"white\" BORDER=\"0\">*cab</TD></TR>\n</TABLE></TD></TR>\n</TABLE>\
>];\n}\n"
By using Print (or PrinTo, if one wants to print to a file) the string is displayed as follows:
gap> Print(last);
digraph  DClassOfElement {
graph [center=yes,ordering=out];
node [shape=plaintext];
edge [color=cornflowerblue,arrowhead=none];
1 [label=<
<TABLE BORDER="0" CELLBORDER="0" CELLPADDING="0" CELLSPACING="0" PORT="1">
<TR><TD BORDER="0"><TABLE CELLSPACING="0"><TR><TD BGCOLOR="white" BORDER="0">*\
abc</TD></TR>
</TABLE></TD><TD BORDER="0"><TABLE CELLSPACING="0"><TR><TD BGCOLOR="white" BOR\
DER="0">a</TD></TR>
</TABLE></TD><TD BORDER="0"><TABLE CELLSPACING="0"><TR><TD BGCOLOR="white" BOR\
DER="0">ab</TD></TR>
</TABLE></TD></TR>
<TR><TD BORDER="0"><TABLE CELLSPACING="0"><TR><TD BGCOLOR="white" BORDER="0">b\
c</TD></TR>
</TABLE></TD><TD BORDER="0"><TABLE CELLSPACING="0"><TR><TD BGCOLOR="white" BOR\
DER="0">*bca</TD></TR>
</TABLE></TD><TD BORDER="0"><TABLE CELLSPACING="0"><TR><TD BGCOLOR="white" BOR\
DER="0">b</TD></TR>
</TABLE></TD></TR>
<TR><TD BORDER="0"><TABLE CELLSPACING="0"><TR><TD BGCOLOR="white" BORDER="0">c\
</TD></TR>
</TABLE></TD><TD BORDER="0"><TABLE CELLSPACING="0"><TR><TD BGCOLOR="white" BOR\
DER="0">ca</TD></TR>
</TABLE></TD><TD BORDER="0"><TABLE CELLSPACING="0"><TR><TD BGCOLOR="white" BOR\
DER="0">*cab</TD></TR>
</TABLE></TD></TR>
</TABLE>>];
}
‣ DrawDClasses( arg ) | ( function ) |
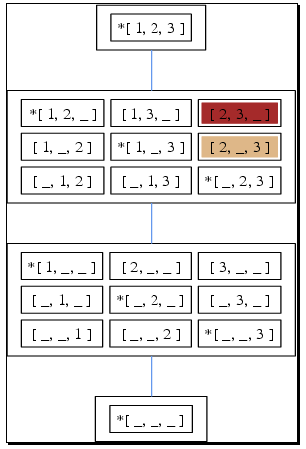
This function is similar to the previous one, except that this one draws all the D-classes of the semigroup given as the first argument. It then takes optionally n lists of elements and the elements of each list will be drawn in different colours. It also accepts, as an optional argument, the integer 1, to specify whether the elements will appear as words or as transformations as in the previous function. The idempotents will be marked with a * before them.
The dot code is computed by DotForDrawingDClasses (3.2-2).
This last optional argument may also be the integer 2 and in this case the elements will appear as integers, where i represents the element Elements(S)[i].
gap> DrawDClasses(poi3);
gap> DrawDClasses(poi3, [Transformation( [ 2, 3, 4, 4 ] ),
  Transformation( [ 2, 4, 3, 4 ] )],
  [Transformation( [ 2, 4, 3, 4 ] )],1);
This is the image produced by the first command in the previous example:

‣ DotForDrawingDClasses( arg ) | ( function ) |
This function computes the dot code that can be used to produce a drawing for the D-class of an element of a semigroup. This can be done by using the function DrawDClasses (3.2-1) (if the system is properly configured) or by the user in some independent way. The arguments and options are the same than those of DrawDClasses (3.2-1).
gap> Print(DotForDrawingDClasses(poi3));
digraph  DClasses {
graph [center=yes,ordering=out];
node [shape=plaintext];
edge [color=cornflowerblue,arrowhead=none];
## ... many more lines ...
</TABLE></TD></TR>
</TABLE>>];
4:4 -> 3:3;
3:3 -> 2:2;
2:2 -> 1:1;
}
‣ DrawRightCayleyGraph( S ) | ( function ) |
Draws the right Cayley graph of a finite monoid or semigroup S.
‣ DrawCayleyGraph( S ) | ( function ) |
This function is a synonym of DrawRightCayleyGraph (3.3-1).
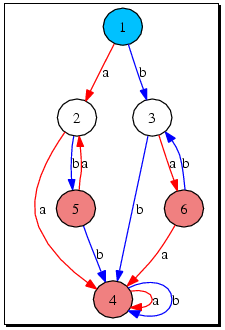
For example, the command DrawCayleyGraph(b21); would produce the following image (where state i represents the element Elements(S)[i], the neutral element is coloured in "light blue" and all other idempotents are coloured in "light coral"):
‣ DotForDrawingRightCayleyGraph( S ) | ( function ) |
This function computes the dot code that is used by the previous function and can also be used by the reader in some independent way.
‣ DrawSchutzenbergerGraphs( S ) | ( function ) |
Draws the Schützenberger graphs of the inverse semigroup S.
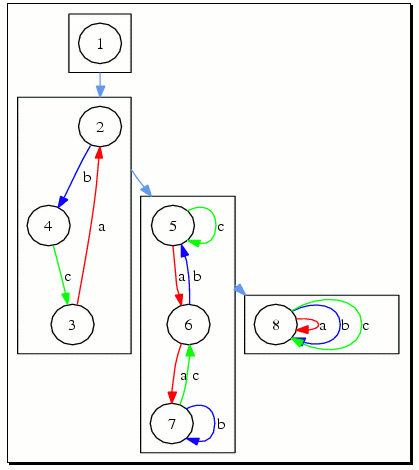
For example, DrawSchutzenbergerGraphs(poi3); would produce the following:
By default, when a drawing is requested, it is outputted in pdf format. Since graphviz allows other output formats (see http://www.graphviz.org/doc/info/output.html), it is possible to also request a drawing in a format other than pdf.
‣ DrawingsListOfExtraFormats | ( global variable ) |
This is a global variable which holds the valid output formats for a drawing. It currently has the value: ["dia", "fig", "gd", "gd2", "gif", "hpgl", "jpg", "mif", "mp", "pcl", "pic", "plain", "plain-ext", "png", "ps", "ps2", "svg", "svgz", "vrml", "vtx", "wbmp", "none"] (see http://www.graphviz.org/doc/info/output.html for their description).
‣ DrawingsExtraFormat | ( global variable ) |
This is a global variable which holds the alternative output format for a drawing. By default its value is "none" which indicates that just pdf will be used as the output format.
If its value becomes one of those in DrawingsListOfExtraFormats (3.5-1), then besides the pdf file, it will also be created a file in the alternative format.
To change this variable's value, please use SetDrawingsExtraFormat (3.5-3).
‣ SetDrawingsExtraFormat( f ) | ( function ) |
This function is used to set the value of DrawingsExtraFormat (3.5-2) to the format f which is one of DrawingsListOfExtraFormats (3.5-1).
gap> DrawingsExtraFormat;
"none"
gap> SetDrawingsExtraFormat("jpg");
gap> DrawingsExtraFormat;
"jpg"

gap> DrawRightCayleyGraph(poi3);
Displaying file: /tmp/tmp.tpJqvI/cayleygraph.dot.ps
The extra output format file: /tmp/tmp.tpJqvI/cayleygraph.dot.jpg
has also been created.
The functions described in this subsection are intended to give the user a finer control over the final drawing. They allow to define the graph attributes described in http://graphviz.org/doc/info/attrs.html. (Note that only graph attributes are allowed to be defined, not edge nor node attributes are supported yet.)
‣ DrawingsExtraGraphAttributes | ( global variable ) |
This is a global variable which holds a list of strings, each of which defines a dot graph attribute. This variable is not intended to be modified by the user directly, but can be used to check which extra attributes are currently defined. To set the attributes, please use SetDrawingsExtraGraphAttributes (3.6-2). If DrawingsExtraGraphAttributes holds the value "none" then the default dot settings will be used. Use ClearDrawingsExtraGraphAttributes (3.6-3) to set it to "none".
‣ SetDrawingsExtraGraphAttributes( L ) | ( function ) |
This is the function to define the drawing's graph attributes (see http://graphviz.org/doc/info/attrs.html for a list and explanation of them). the argument L is a list of strings, each of which defines a dot graph attribute. For example, if we wanted to define the graph size to be 7x9 (in inches), we would call SetDrawingsExtraGraphAttributes(["size=7,9"]);.
If we also wanted to define the graph to be displayed in landscape mode we would call SetDrawingsExtraGraphAttributes(["size=7,9", "rotate=90"]);. If, in addition we wanted to define the background colour to be, for example, pink, we would call SetDrawingsExtraGraphAttributes(["size=7,9", "rotate=90", "bgcolor=pink"]);.
After defining the attributes, any command that creates a drawing will use the last defined attributes. To set them back to the defaults, please use ClearDrawingsExtraGraphAttributes (3.6-3).
gap> DrawingsExtraGraphAttributes;
"none"


gap> SetDrawingsExtraGraphAttributes(["size=7,9"]);

gap> DrawingsExtraGraphAttributes;
[ "size=7,9" ]


gap> SetDrawingsExtraGraphAttributes(["size=7,9", "rotate=90"]);

gap> DrawingsExtraGraphAttributes;
[ "size=7,9", "rotate=90" ]


gap> SetDrawingsExtraGraphAttributes(["size=7,9", "rotate=90", "bgcolor=pink"]);

gap> DrawingsExtraGraphAttributes;
[ "size=7,9", "rotate=90", "bgcolor=pink" ]


gap> ClearDrawingsExtraGraphAttributes();

gap> DrawingsExtraGraphAttributes;
"none"
‣ ClearDrawingsExtraGraphAttributes( ) | ( function ) |
This function sets the graph drawing attributes back to dot's defaults.
generated by GAPDoc2HTML