The drawing of graphs described here uses graphviz [DEGKNW02], a software for drawing graphs developed at AT & T Labs, that can be obtained at http://www.graphviz.org/.
In order to create the drawings you should install graphviz and to view them you should install one of evince, ggv, gsview or gv.
‣ DrawAutomaton( A[, state_names, L, file] ) | ( function ) |
This function draws automaton A. The arguments state_names, L and file are optional.
An automaton with n states will be drawn with numbers 1 to n written inside the corresponding graph node. The argument state_names is a list of n strings which will be the new text written inside the corresponding graph node.
The argument L is a list of lists of integers, each of which specifies a set of states to be drawn in a different color.
The argument file is a string that specifies the name of the file containing the drawing. If it is not give, it defaults to "automaton".
gap> x:=Automaton("det",3,2,[ [ 2, 3, 0 ], [ 0, 1, 2 ] ],[ 1 ],[ 1, 2, 3 ]);;
gap> DrawAutomaton(x,"file_name");
Displaying file: /tmp/tmp.Rj0v1s/file_name.dot.ps

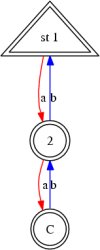
gap> DrawAutomaton(x,["st 1", "2", "C"],"file_name");
Displaying file: /tmp/tmp.BCH3FO/file_name.dot.ps

gap> DrawAutomaton(x,["st 1", "2", "C"],[[2],[1,3]]);
Displaying file: /tmp/tmp.LPnJMq/automaton.dot.ps
The output of the three previous DrawAutomaton commands would be the following diagrams displayed in a ghostview window, respectively.


‣ DrawAutomata( A, B[, file] ) | ( function ) |
This function tests if automaton A is a subautomaton of B in which case draws B highlighting the edges not in A by drawing them in a dotted style, while the others are drawn in a plain style.
‣ DrawGraph( G[, file] ) | ( function ) |
Draws a graph specified as an adjacency list G.
‣ DrawSCCAutomaton( A[, state_names, L, file] ) | ( function ) |
Draws automaton A and highlights it's strongly connected components by drawing the other edges in a dotted style.
The optional arguments state_names, L and file are as described in DrawAutomaton (B.2-1).
Since drawings are mostly used in the SgpViz package, please refer to that package's manual section of the same name.
Since drawings are mostly used in the SgpViz package, please refer to that package's manual section of the same name.
generated by GAPDoc2HTML