Path: blob/master/2019-fall/slides/03_wrangling.ipynb
2707 views
DSCI 100 - Introduction to Data Science
Lecture 3 - Wrangling to get tidy data
2019-09-19
Shameless borrowing of slides from Jenny Bryan


How should you wrangle your data?
We make it "tidy"
What is tidy data?
A tidy data is one that is satified by these three criteria:
each row is a single observation,
each variable is a single column, and
each value is a single cell (i.e., its row, column position in the data frame is not shared with another value)

Source: R for Data Science by Garrett Grolemund & Hadley Wickham
A tale of 4 data tables...
...here is the same data represented in 4 different ways, let's vote on which are tidy
Example source: https://garrettgman.github.io/tidying/
Statistical question: What variables are associated with the number of TB cases?
This data is tidy, true or false?
| country | year | rate |
|---|---|---|
| Afghanistan | 1999 | 745/19987071 |
| Afghanistan | 2000 | 2666/20595360 |
| Brazil | 1999 | 37737/172006362 |
| Brazil | 2000 | 80488/174504898 |
| China | 1999 | 212258/1272915272 |
| China | 2000 | 213766/1280428583 |
| runner | region | country | speed |
|---|---|---|---|
| Olusoji Fasuba | Africa | Nigeria | 9.85/100 |
| Murielle Ahouré | Africa | Ivory Coast | 10.78/100 |
| Femi Ogunode | Asia | Qatar | 9.91/100 |
| Su Bingtian | Asia | China | 9.91/100 |
| Li Xuemei | Asia | China | 10.79 |
| country | cases (year=1999) | cases (year=2000) |
|---|---|---|
| Afghanistan | 745 | 2666 |
| Brazil | 37737 | 80488 |
| China | 212258 | 213766 |
| country | population (year=1999) | population (year=2000) |
|---|---|---|
| Afghanistan | 19987071 | 20595360 |
| Brazil | 172006362 | 174504898 |
| China | 1272915272 | 1280428583 |
Statistical question: What variables are associated with the number of TB cases?
This data is tidy, true or false?
| country | year | cases | population |
|---|---|---|---|
| Afghanistan | 1999 | 745 | 19987071 |
| Afghanistan | 2000 | 2666 | 20595360 |
| Brazil | 1999 | 37737 | 172006362 |
| Brazil | 2000 | 80488 | 174504898 |
| China | 1999 | 212258 | 1272915272 |
| China | 2000 | 213766 | 1280428583 |
Statistical question: What variables are associated with the number of TB cases?
This data is tidy, true or false?
| country | year | key | value |
|---|---|---|---|
| Afghanistan | 1999 | cases | 745 |
| Afghanistan | 1999 | population | 19987071 |
| Afghanistan | 2000 | cases | 2666 |
| Afghanistan | 2000 | population | 20595360 |
| Brazil | 1999 | cases | 37737 |
| Brazil | 1999 | population | 172006362 |
| Brazil | 2000 | cases | 80488 |
| Brazil | 2000 | population | 174504898 |
| China | 1999 | cases | 212258 |
| China | 1999 | population | 1272915272 |
| China | 2000 | cases | 213766 |
| China | 2000 | population | 1280428583 |
Tools for getting it there:
tidyversepackage functions from:dplyrpackage (select,filter,mutate,group_by,summarize)tidyrpackage (gather)purrrpackage (*map*)
Another big concept this week: iteration
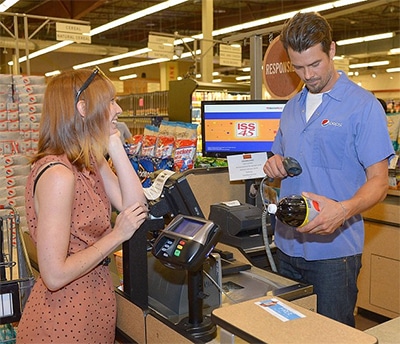
iteration is when you need to do something repeatedly (e.g., ringing in and bagging groceries at the till)

Tidyverse tools for iteration
group_by+summarize*map*
group_by + summarize
useful when you want to do something repeatedly to a group of rows
an example, we want to calculate the average life expectancy (
lifeExp) for each continent from thegapminderdata set
── Attaching packages ─────────────────────────────────────── tidyverse 1.2.1 ──
✔ ggplot2 3.2.0     ✔ purrr   0.3.2
✔ tibble  2.1.3     ✔ dplyr   0.8.3
✔ tidyr   0.8.3     ✔ stringr 1.4.0
✔ readr   1.3.1     ✔ forcats 0.4.0
── Conflicts ────────────────────────────────────────── tidyverse_conflicts() ──
✖ dplyr::filter() masks stats::filter()
✖ dplyr::lag()    masks stats::lag()
Parsed with column specification:
cols(
  country = col_character(),
  year = col_double(),
  pop = col_double(),
  continent = col_character(),
  lifeExp = col_double(),
  gdpPercap = col_double()
)
First, let's filter for only 1 year, 2007
Now let's use group_by + summarize to iterate
Goal: calculate average life expectancy in 2007 for each continent
*map*
useful when you want to do something repeatedly to almost anything (we'll give the example of columns in a data frame)
an example, we want to calculate the average value for each column from the
USAarrestsdata to get the average across all US states
use *map* to iterate
Calculate the average/mean of each column:
But why isn't our output a data frame?
*map* functions output depends on which function you use...
map function | Output |
|---|---|
map() | list |
map_lgl() | logical vector |
map_int() | integer vector |
map_dbl() | double vector |
map_chr() | character vector |
map_df() | data frame |
use map_df instead:
Go forth and wrangle!
we'll be here to help if you need it!

Class activity 1
Calculate the mean petal length for each of the Iris (flower) species in the iris dataset. Post your answer on Piazza when you are done.
Class activity 2
Use map_df to caclulate the mean of each of the numerical columns in the iris dataset. Post your answer on Piazza when you are done.
