
Path: blob/master/2019-fall/slides/06_classfication_intro.ipynb
2707 views
DSCI 100 - Introduction to Data Science
Lecture 6 - Classification using K-Nearest Neighbours
First, a little housekeeping
Quiz grading will be finished as soon as possible!
Please fill out the mid-course survey (if you already have, thanks!)

Classification
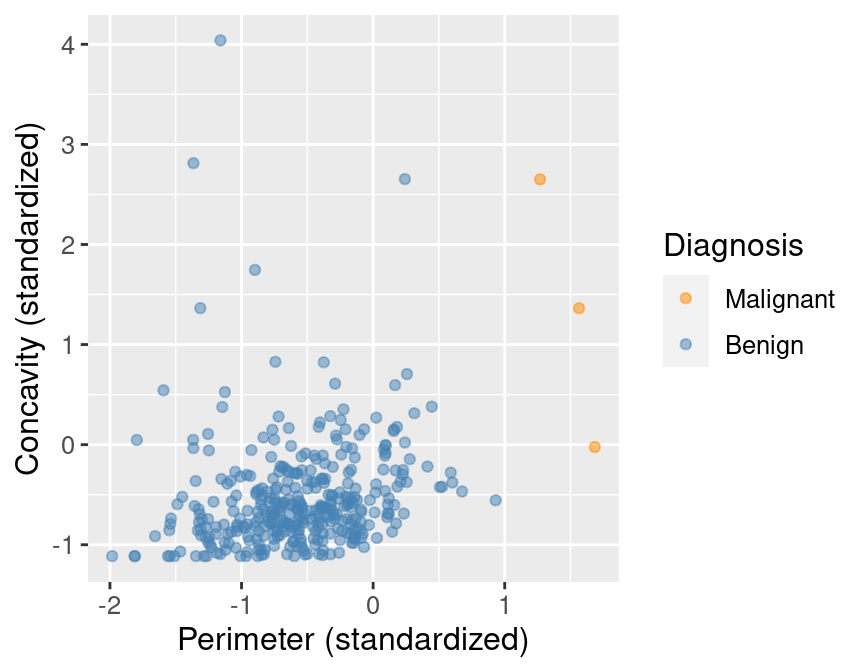
Suppose we have past data of cancer tumour cell diagnosis labelled "benign" and "malignant".
Do you think a new cell with Concavity = 4.2 and Perimeter = -1 would be cancerous?
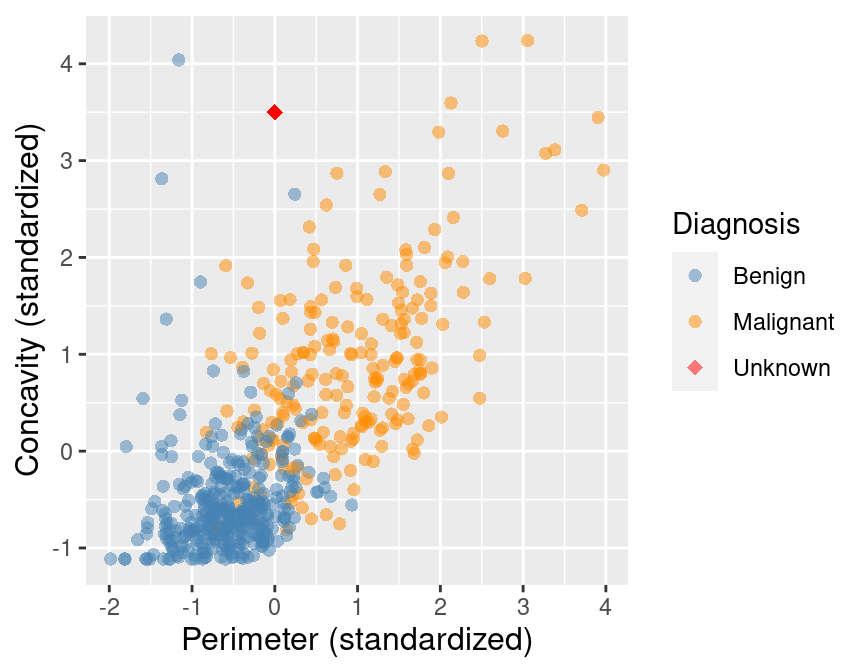
What kind of data analysis question is this?
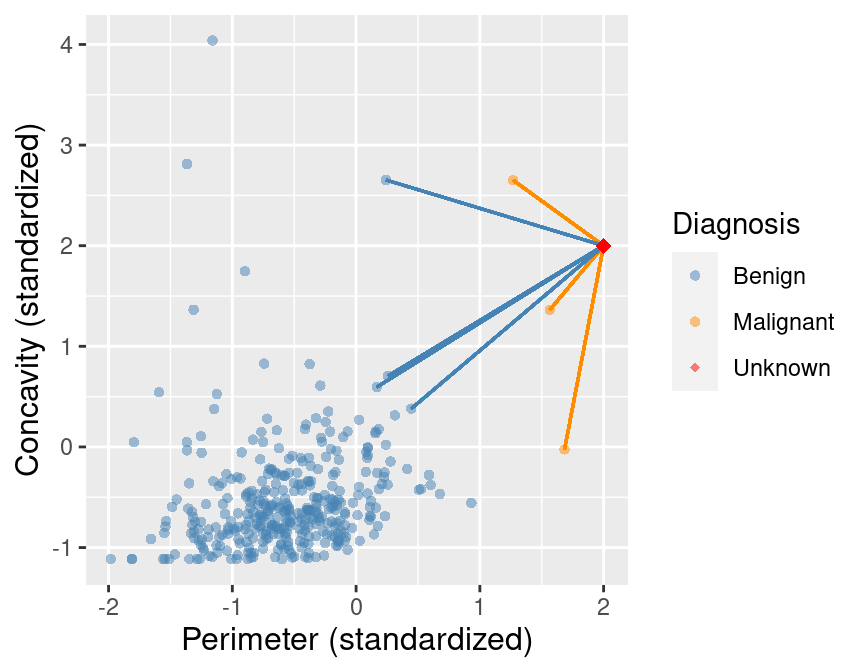
K-nearest neighbours classification
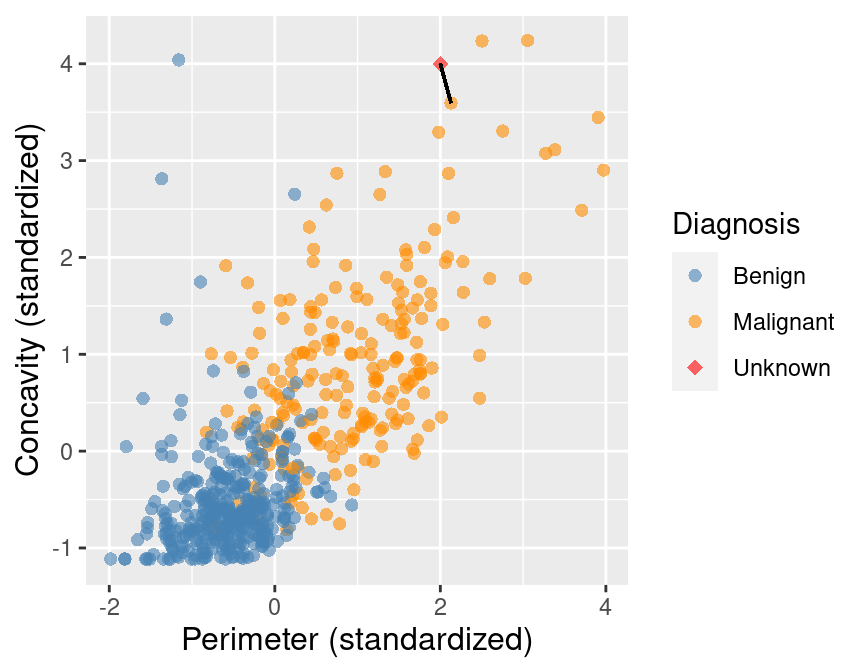
Predict the label / class for a new observation using the K closest points from our dataset.
Compute the distance between the new observation and each observation in our training set
K-nearest neighbours classification
Predict the label / class for a new observation using the K closest points from our dataset.
Sort the data in ascending order according to the distances
Choose the top K rows as "neighbours"
K-nearest neighbours classification
Predict the label / class for a new observation using the K closest points from our dataset.
Classify the new observation based on majority vote.
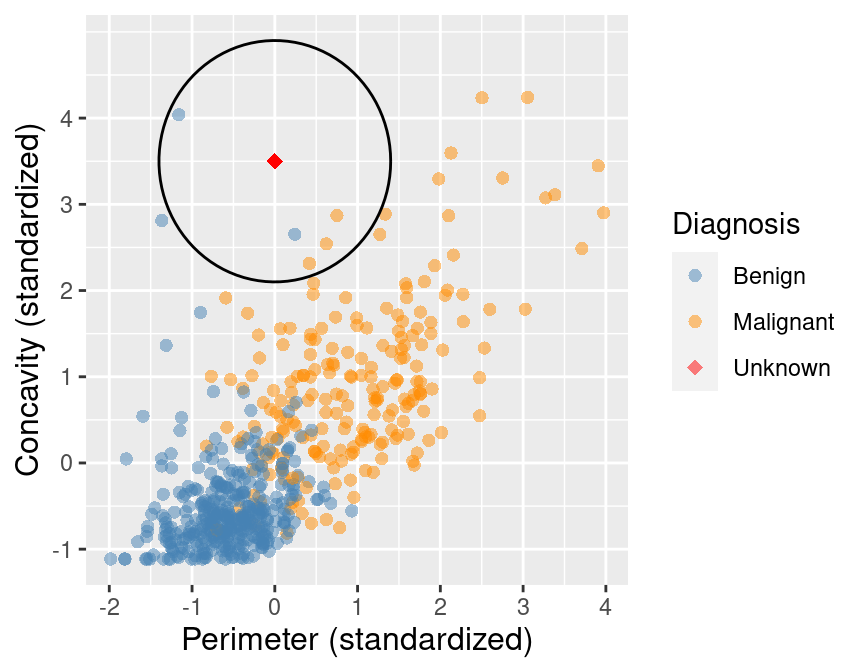
What would the predicted class be?
We can go beyond 2 predictors
For two observations , each with variables (columns) labelled ,
Aside from that, it's the same algorithm!
Standardized Data
What if one variable is much larger than the other? e.g. Salary (10,000+) and Age (0-100)
Standardize: shift and scale so that the average is 0 and the standard deviation is 1.

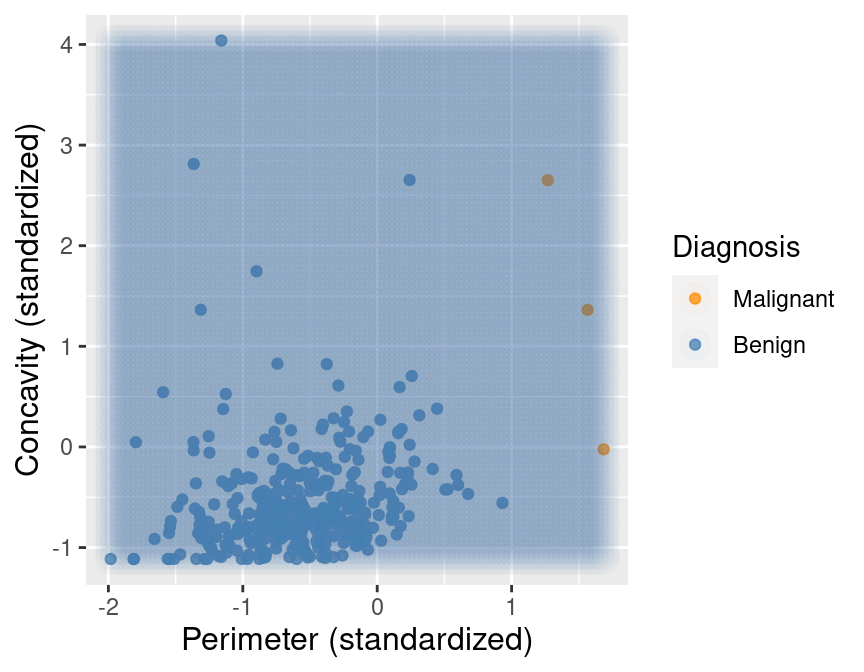
Unbalanced Data
What if one label is far more common than another?
E.g. if this is a very rare kind of cancer, we may have far more benign observations
Will K = 7-Nearest Neighbours ever predict malignance?
Unbalanced Data
Unbalanced Data
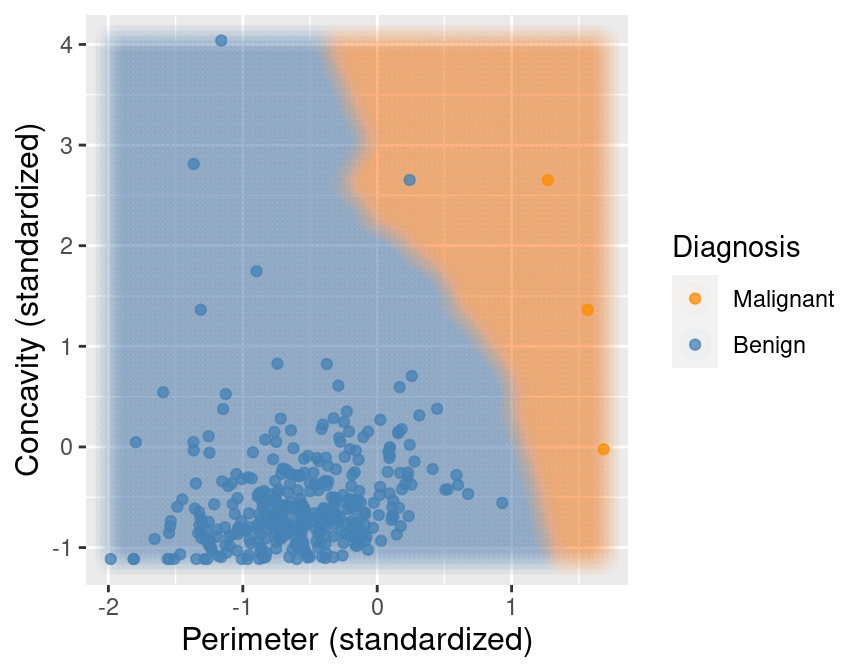
Oversampling to Rebalance
Replicate the data in the smaller class to increase its count / voting power
Introduction to the caret package in R
Caret handles computing distances, standardization, balancing, and prediction for us!
Load the libraries and data we need (new:
caret)
Introduction to the caret package in R
Split your table of training data into
(make this a vector)
's (make this a
data.frame, not atibble)
Introduction to the caret package in R
"Fit" your model:
choose and create a
data.framewith one column (namedk) and one valueuse
trainand feed it , , the method ("knn"), and
Introduction to the caret package in R
Predict using your model by using
predictand passing it your model object and the new observation (as adata.frame)
Go forth and ... model?

Class challenge
Suppose we have a new observation in the iris dataset, with
petal length = 5
petal width = 0.6
Using R and the caret package, how would you classify this observation based on nearest neighbours?