
Path: blob/master/2019-fall/slides/10_introduction_to_inference.ipynb
2715 views
DSCI 100 - Introduction to Data Science
Lecture 11 - Introduction to inference & sampling through simulation
What is statistical inference?
Statistical inference is the process of using a small sample to make conclusions about the wider population the sample came from
Examples of types of inference: estimation and testing
Things we can do with inference
1. Make a statement such as this:
Based on a the results of the latest poll, we estimate that 47.2% of Americans think that firearms should have strong regulations or restrictions when thinking about gun ownership rights and gun laws.
source: http://polling.reuters.com/#!response/PV20/type/smallest/dates/20180505-20181002/collapsed/true
This is estimation!
2. Answer a marketing question such as this:
What proportion of undergraduate students have an iphone?

This can be answered with estimation!
3. or a health question such as this:
Are first babies born later than non-first born babies?

This can be answered with a hypothesis test!
4. or a A/B testing question such as this:
Which of the 2 website designs will lead to more customer engagement (measured by click-through-rate, for example)?
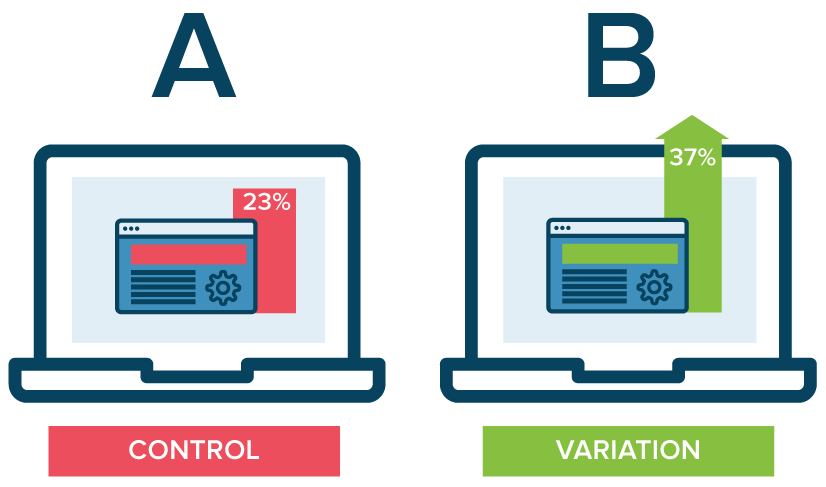
This can be answered with a hypothesis test!
Estimation
What is estimation? And how do we do it?
Marketing example revisited
Question: What proportion of undergraduate students have an iphone?
How could we answer this question? Discuss with your neighbour.

What if we randomly selected a subset and then asked them if they have an iphone? We could then calculate a proportion that we could use as an estimate of the true population proportion (parameter)? Could this work?

Let's experiment and see how well sample estimates reflect the true population parameter we are interested in measuring!
Virtual sampling simulation
Let's create a virtual box of timbits (our population)
Let's each use R to:
collect a random sample of 40 timbits,
calculate a proportion of chocolate timbits
add our proportion to this shared Google sheet to build a distribution of this sample statistic

As always, load the libraries we'll be using:
1. Create a virtual box of timbits (population)
Let's "create" a population of 10000 timbits where the proportion of chocolate timbits is 0.63 and the proportion of old fashioned timbits is 0.37.
IMPORTANT - set your seed to 1234 so that we all create the same population!
Here we use
rbinomto "create" the population of 10000 timbits where the proportion of chocolate is 0.63 and the proportion of old fashioned is 0.37.
We also use
seqto create a column calledtimbit_idthat holds the value from 1 to 10000.
We use
tibbleto make keep these two columns together as a data frame (tibble is a special type of data frame that you will learn more about in the Data Wrangling course).
Sanity check that the virtual box contains ~ 63% chocolate timbits:
2. Drawing a single sample of size 40
Let's simulate taking one random sample from our virtual timbits box. We will use the rep_sample_n function from the infer package:
We can tell by the timbit_id column that R indeed did what we asked - randomly selected 40 timbits from our virtual box.
What is the proportion of chocolate in our single sample?
summarizeapplies a a data transformation across the rows of a data frame (more about this in Data Wrangling)
Add our calculated proportion to the shared Google sheet
Now it's your turn! Go!
Collect a random sample of 40 timbits & calculate the sum and proportion of chocolate timbits (code given below).
add your proportion to this shared Google sheet to build a distribution of this sample statistic.
Discussion time
How well do our samples represent the population parameter we are interested in (proportion of chocolate timbits)?
Back to our marketing example
Is randomly selecting a subset of the students (taking a single sample) and then asking them if they have an iphone a good way to estimate the true proportion of all undergraduates who have iphones (population parameter we are interested in)?
Wrap-up
What did we learn so far today? Let's make a list here!
Questions that we will try to answer next?
Usually we only have one sample? So what can we do?
Acknowledgements
Data Science in a box by Mine Cetinkaya-Rundel
Inference in 3 hours by Allan Downey
Modern Dive: An Introduction to Statistical and Data Sciences via R by Chester Ismay and Albert Y. Kim