
Path: blob/master/2019-spring/slides/03_wrangling.ipynb
2707 views
DSCI 100 - Introduction to Data Science
Lecture 3 - Wrangling to get tidy data
2019-01-17

Shameless borrowing of slides from Jenny Bryan


How should you wrangle your data?
We make it "tidy"
Lord of the Rings example
I will give you a concrete example of some untidy data from this data from the Lord of the Rings Trilogy.
The Fellowship Of The Ring
Race
Female
Male
Elf
1229
971
Hobbit
14
3644
Man
0
1995
The Two Towers
Race
Female
Male
Elf
331
513
Hobbit
0
2463
Man
401
3589
The Return Of The King
Race
Female
Male
Elf
183
510
Hobbit
2
2673
Man
268
2459
Here’s how the same data looks in tidy form:
Film
Gender
Race
Words
The Fellowship Of The Ring
Female
Elf
1229
The Fellowship Of The Ring
Male
Elf
971
The Fellowship Of The Ring
Female
Hobbit
14
The Fellowship Of The Ring
Male
Hobbit
3644
The Fellowship Of The Ring
Female
Man
0
The Fellowship Of The Ring
Male
Man
1995
The Two Towers
Female
Elf
331
The Two Towers
Male
Elf
513
The Two Towers
Female
Hobbit
0
The Two Towers
Male
Hobbit
2463
The Two Towers
Female
Man
401
The Two Towers
Male
Man
3589
The Return Of The King
Female
Elf
183
The Return Of The King
Male
Elf
510
The Return Of The King
Female
Hobbit
2
The Return Of The King
Male
Hobbit
2673
The Return Of The King
Female
Man
268
The Return Of The King
Male
Man
2459
What is tidy data?
A tidy data is one that is satified by these three criteria:
each row is a single observation,
each variable is a single column, and
each value is a single cell (i.e., its row, column position in the data frame is not shared with another value)
 *image source: [R for Data Science](https://r4ds.had.co.nz/) by Garrett Grolemund & Hadley Wickham*
Tools for getting it there:
tidyversepackage functions from:dplyrpackage (select,filter,mutate,group_by,summarize)tidyrpackage (gather)purrrpackage (*map*)
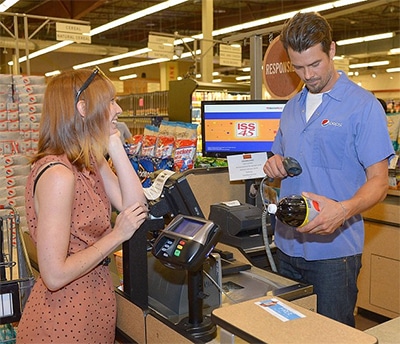
Another big concept this week: iteration
iteration is when you need to do something repeatedly (e.g., ringing in and bagging groceries at the till)
Tidyverse tools for iteration
group_by+summarize*map*
group_by + summarize
useful when you want to do something repeatedly to a group of rows
an example, we want to calculate the average life expectancy (
lifeExp) for each continent from thegapminderdata set
First, let's filter for only 1 year, 2007
Now let's use group_by + summarize to iterate
Goal: calculate average life expectancy for each continent
*map*
useful when you want to do something repeatedly to almost anything (we'll give the example of columns in a data frame)
an example, we want to calculate the average value for each column from the
USAarrestsdata to get the average across all US states
use *map* to iterate
But why isn't our output a data frame?
*map* functions output depends on which function you use...
map function | Output |
|---|---|
map() | list |
map_lgl() | logical vector |
map_int() | integer vector |
map_dbl() | double vector |
map_chr() | character vector |
map_df() | data frame |
use map_df instead:
Go forth and wrangle!
we'll be here to help if you need it!

Class activity 1
Calculate the mean petal length for the Iris (flower) species in the iris dataset:
Class activity 2
Use map_df to caclulate the mean of each of the numerical columns in the iris dataset.
What did we learn?
anti-
selectis-COLUMN_NAMEiteration (
map&group_by+summarize)gather(wide to long)