Path: blob/master/2019-spring/slides/10_regression3.ipynb
2051 views
DSCI 100 - Introduction to Data Science
Lecture 10 - Introduction to linear regression
2019-03-21
Final exam details:
Friday, April 26th at 19:00 in BUCH A102
Format - same as quizzes (open book, on Canvas)
Length - it will be longer than the quizzes...
Covers entire course content, with more questions on topics that were not covered on the quizzes
Multivariate regression problem
For example, use house size and number of baths to predict house sale price

k-nn multivariate regression

linear multivariate regression

The two sides of regression
Regression for prediction
Regression for understanding/description (statistical inference)
Regression for understanding/description questions
How strong is the relationship between the outcome/response variable and the explanatory variable(s)?
Which of the explanatory variables contribute to the outcome/response variable?
How accurately can we estimate the effect of each explanatory variable on the outcome/response variable?
Simple example of statistical inference
Question: What proportion of undergraduate students have an iphone?

We can't possibly ask all undergraduates if they have an iphone... so what can we do? 
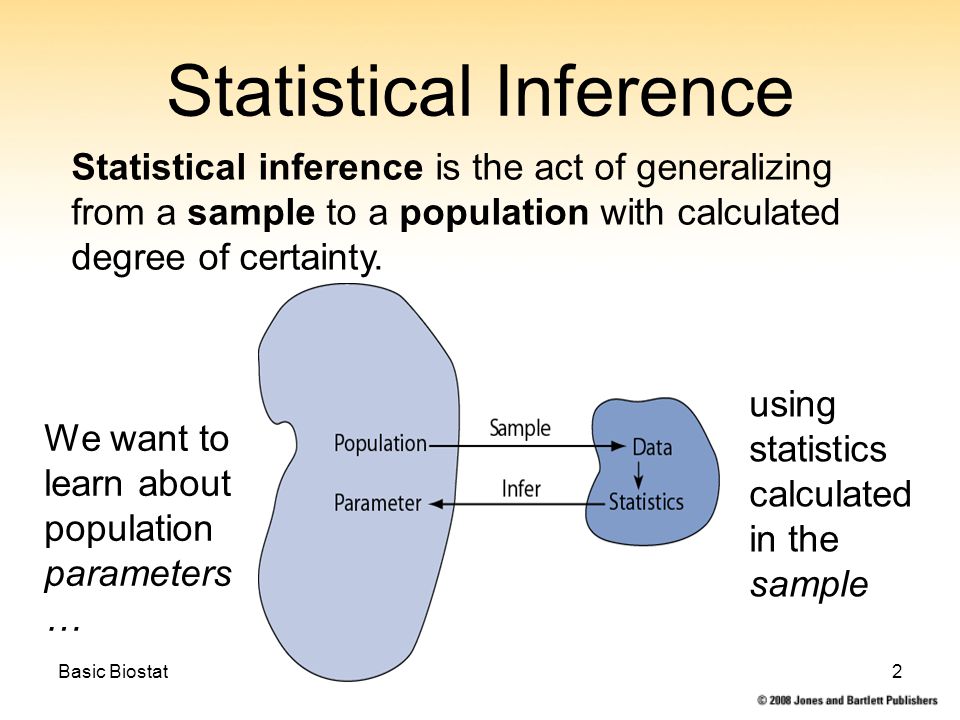
What if we randomly selected a subset and then asked them if they have an iphone? We could then calculate a proportion that we could use as an estimate of the true population proportion!

We often want to report a plausible range, along with the proportion we estimate...

Population parameters can be proportions (iPhone example) or regression line slopes.