Book a Demo!
CoCalc Logo Icon
StoreFeaturesDocsShareSupportNewsAboutPoliciesSign UpSign In
holoviz
GitHub Repository: holoviz/panel
Path: blob/main/doc/how_to/styling/altair.md
2012 views

Style Altair Plots

This guide addresses how to style Altair plots displayed using the Vega pane.

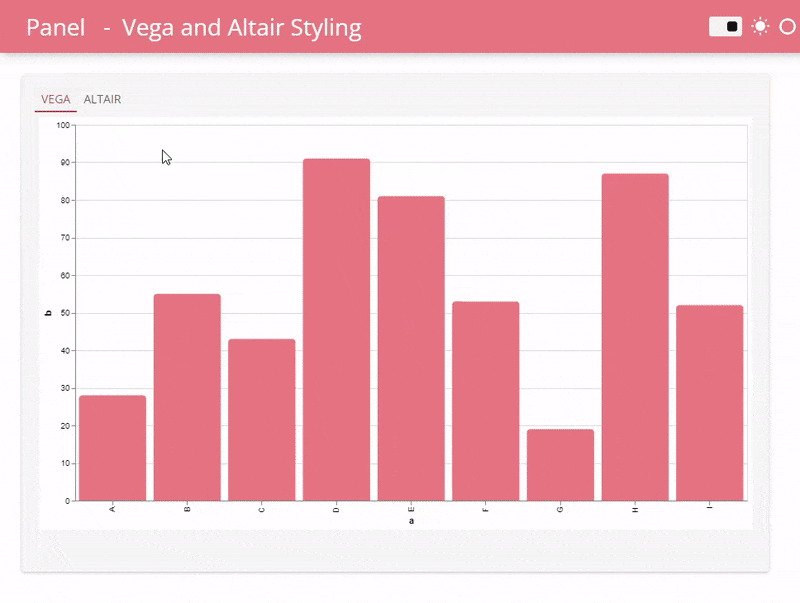
You can select the theme of Altair plots using altair.themes.enable and an accent color using the configure_mark method. The list of themes is available via altair.themes.names().

The gif below displays an example of what can be achieved with a little styling of the Altair plot and the FastListTemplate.

VegaAltairStyle.gif

An Altair plot with custom theme and accent color

In this example we will give the Altair plot a custom theme and accent color.

import altair as alt import panel as pn from vega_datasets import data pn.extension("vega") def plot(theme, color): alt.theme.enable(theme) return ( alt.Chart(data.cars()) .mark_circle(size=200) .encode( x='Horsepower:Q', y='Miles_per_Gallon:Q', tooltip=["Name", "Origin", "Horsepower", "Miles_per_Gallon"], ) .configure_mark( color=color ) .properties( height=300, width="container", ) .interactive() ) themes = sorted(alt.theme.names()) theme = pn.widgets.Select(value="dark", options=themes, name="Theme") color = pn.widgets.ColorPicker(value="#F08080", name="Color") pn.Column( pn.Row(theme, color), pn.pane.Vega(pn.bind(plot, theme=theme, color=color), height=350, sizing_mode="stretch_width"), "**Altair Themes**: " + ", ".join(themes), styles={"border": "1px solid lightgray"} ).servable()

Please note that the line alt.theme.enable(theme) will set the theme of all future generated plots unless you specifically change it before usage in a Vega pane.