
Path: blob/master/deprecated/notebooks/student_pgm.ipynb
2253 views
Kernel: Python 3
![]()
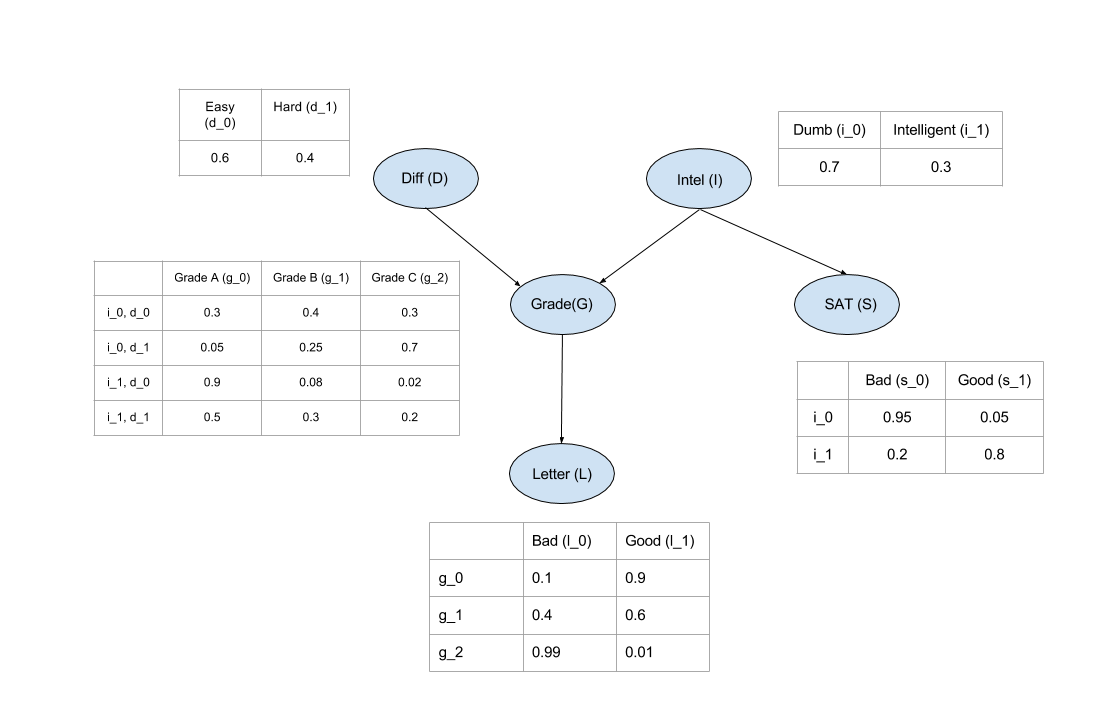
The (simplified) student Bayes net
This model is from https://github.com/pgmpy/pgmpy_notebook/blob/master/notebooks/2. Bayesian Networks.ipynb
In [1]:
Out[1]:
     |████████████████████████████████| 1.9 MB 4.1 MB/s
Collecting superimport
  Downloading superimport-0.3.4.tar.gz (6.0 kB)
Requirement already satisfied: requests in /usr/local/lib/python3.7/dist-packages (from superimport) (2.23.0)
Requirement already satisfied: idna<3,>=2.5 in /usr/local/lib/python3.7/dist-packages (from requests->superimport) (2.10)
Requirement already satisfied: chardet<4,>=3.0.2 in /usr/local/lib/python3.7/dist-packages (from requests->superimport) (3.0.4)
Requirement already satisfied: urllib3!=1.25.0,!=1.25.1,<1.26,>=1.21.1 in /usr/local/lib/python3.7/dist-packages (from requests->superimport) (1.24.3)
Requirement already satisfied: certifi>=2017.4.17 in /usr/local/lib/python3.7/dist-packages (from requests->superimport) (2021.10.8)
Building wheels for collected packages: superimport
  Building wheel for superimport (setup.py) ... done
  Created wheel for superimport: filename=superimport-0.3.4-py3-none-any.whl size=5888 sha256=aff8dbabb07f3802e05efca77d01225c61beaf08305bca7ad76b0891f4a287a9
  Stored in directory: /root/.cache/pip/wheels/6c/66/dc/337052d868002cf3830606ee34d91d1ceff6a67bf8df982c72
Successfully built superimport
Installing collected packages: superimport
Successfully installed superimport-0.3.4
INFO:numexpr.utils:NumExpr defaulting to 2 threads.
In [2]:
Model
In [3]:
Out[3]:
/usr/local/lib/python3.7/dist-packages/pgmpy/models/BayesianModel.py:10: FutureWarning: BayesianModel has been renamed to BayesianNetwork. Please use BayesianNetwork class, BayesianModel will be removed in future.
FutureWarning,
Basic CPDs
In [4]:
Out[4]:
True
In [ ]:
+----------+----------+----------+----------+----------+
| Intel | Intel(0) | Intel(0) | Intel(1) | Intel(1) |
+----------+----------+----------+----------+----------+
| Diff | Diff(0) | Diff(1) | Diff(0) | Diff(1) |
+----------+----------+----------+----------+----------+
| Grade(0) | 0.3 | 0.05 | 0.9 | 0.5 |
+----------+----------+----------+----------+----------+
| Grade(1) | 0.4 | 0.25 | 0.08 | 0.3 |
+----------+----------+----------+----------+----------+
| Grade(2) | 0.3 | 0.7 | 0.02 | 0.2 |
+----------+----------+----------+----------+----------+
CPDs with names states
In [5]:
Out[5]:
INFO:root:Replacing existing CPD for Diff
INFO:root:Replacing existing CPD for Intel
INFO:root:Replacing existing CPD for Grade
INFO:root:Replacing existing CPD for Letter
INFO:root:Replacing existing CPD for SAT
True
In [6]:
Out[6]:
+----------+------------+------------+-------------+-------------+
| Intel | Intel(Low) | Intel(Low) | Intel(High) | Intel(High) |
+----------+------------+------------+-------------+-------------+
| Diff | Diff(Easy) | Diff(Hard) | Diff(Easy) | Diff(Hard) |
+----------+------------+------------+-------------+-------------+
| Grade(A) | 0.3 | 0.05 | 0.9 | 0.5 |
+----------+------------+------------+-------------+-------------+
| Grade(B) | 0.4 | 0.25 | 0.08 | 0.3 |
+----------+------------+------------+-------------+-------------+
| Grade(C) | 0.3 | 0.7 | 0.02 | 0.2 |
+----------+------------+------------+-------------+-------------+
In [ ]:
+------------+-----+
| Diff(Easy) | 0.6 |
+------------+-----+
| Diff(Hard) | 0.4 |
+------------+-----+
+-------------+-----+
| Intel(Low) | 0.7 |
+-------------+-----+
| Intel(High) | 0.3 |
+-------------+-----+
+----------+------------+------------+-------------+-------------+
| Intel | Intel(Low) | Intel(Low) | Intel(High) | Intel(High) |
+----------+------------+------------+-------------+-------------+
| Diff | Diff(Easy) | Diff(Hard) | Diff(Easy) | Diff(Hard) |
+----------+------------+------------+-------------+-------------+
| Grade(A) | 0.3 | 0.05 | 0.9 | 0.5 |
+----------+------------+------------+-------------+-------------+
| Grade(B) | 0.4 | 0.25 | 0.08 | 0.3 |
+----------+------------+------------+-------------+-------------+
| Grade(C) | 0.3 | 0.7 | 0.02 | 0.2 |
+----------+------------+------------+-------------+-------------+
+--------------+----------+----------+----------+
| Grade | Grade(A) | Grade(B) | Grade(C) |
+--------------+----------+----------+----------+
| Letter(Bad) | 0.1 | 0.4 | 0.99 |
+--------------+----------+----------+----------+
| Letter(Good) | 0.9 | 0.6 | 0.01 |
+--------------+----------+----------+----------+
+-----------+------------+-------------+
| Intel | Intel(Low) | Intel(High) |
+-----------+------------+-------------+
| SAT(Bad) | 0.95 | 0.2 |
+-----------+------------+-------------+
| SAT(Good) | 0.05 | 0.8 |
+-----------+------------+-------------+
Inference
In [ ]:
/usr/local/lib/python3.7/dist-packages/statsmodels/tools/_testing.py:19: FutureWarning: pandas.util.testing is deprecated. Use the functions in the public API at pandas.testing instead.
import pandas.util.testing as tm
Posterior given Grade=C
In [ ]:
0%| | 0/1 [00:00<?, ?it/s]
0%| | 0/1 [00:00<?, ?it/s]
0%| | 0/1 [00:00<?, ?it/s]
0%| | 0/1 [00:00<?, ?it/s]
Pr(Difficulty=Hard|Grade=C) = 0.63
Pr(Intelligence=High|Grade=C) = 0.08
Posterior given Grade=C, SAT=Good
In [ ]:
0%| | 0/1 [00:00<?, ?it/s]
0%| | 0/1 [00:00<?, ?it/s]
0%| | 0/1 [00:00<?, ?it/s]
0%| | 0/1 [00:00<?, ?it/s]
Pr(Difficulty=Hard|Grade=C,SAT=Good) = 0.76
Pr(Intelligence=High|Grade=C,SAT=Good) = 0.58
Visualization
DAG
In [ ]:
<class 'graphviz.dot.Digraph'>
%0A%20--%3E%0A%3C!--%20Title%3A%20%253%20Pages%3A%201%20--%3E%0A%3Csvg%20width%3D%22148pt%22%20height%3D%22188pt%22%0A%20viewBox%3D%220.00%200.00%20148.09%20188.00%22%20xmlns%3D%22http%3A%2F%2Fwww.w3.org%2F2000%2Fsvg%22%20xmlns%3Axlink%3D%22http%3A%2F%2Fwww.w3.org%2F1999%2Fxlink%22%3E%0A%3Cg%20id%3D%22graph0%22%20class%3D%22graph%22%20transform%3D%22scale(1%201)%20rotate(0)%20translate(4%20184)%22%3E%0A%3Ctitle%3E%253%3C%2Ftitle%3E%0A%3Cpolygon%20fill%3D%22%23ffffff%22%20stroke%3D%22transparent%22%20points%3D%22-4%2C4%20-4%2C-184%20144.0946%2C-184%20144.0946%2C4%20-4%2C4%22%2F%3E%0A%3C!--%20Letter%20--%3E%0A%3Cg%20id%3D%22node1%22%20class%3D%22node%22%3E%0A%3Ctitle%3ELetter%3C%2Ftitle%3E%0A%3Cellipse%20fill%3D%22none%22%20stroke%3D%22%23000000%22%20cx%3D%22106.9475%22%20cy%3D%22-18%22%20rx%3D%2232.4942%22%20ry%3D%2218%22%2F%3E%0A%3Ctext%20text-anchor%3D%22middle%22%20x%3D%22106.9475%22%20y%3D%22-14.3%22%20font-family%3D%22Times%2Cserif%22%20font-size%3D%2214.00%22%20fill%3D%22%23000000%22%3ELetter%3C%2Ftext%3E%0A%3C%2Fg%3E%0A%3C!--%20Intel%20--%3E%0A%3Cg%20id%3D%22node2%22%20class%3D%22node%22%3E%0A%3Ctitle%3EIntel%3C%2Ftitle%3E%0A%3Cellipse%20fill%3D%22none%22%20stroke%3D%22%23000000%22%20cx%3D%2230.9475%22%20cy%3D%22-162%22%20rx%3D%2227.0966%22%20ry%3D%2218%22%2F%3E%0A%3Ctext%20text-anchor%3D%22middle%22%20x%3D%2230.9475%22%20y%3D%22-158.3%22%20font-family%3D%22Times%2Cserif%22%20font-size%3D%2214.00%22%20fill%3D%22%23000000%22%3EIntel%3C%2Ftext%3E%0A%3C%2Fg%3E%0A%3C!--%20SAT%20--%3E%0A%3Cg%20id%3D%22node3%22%20class%3D%22node%22%3E%0A%3Ctitle%3ESAT%3C%2Ftitle%3E%0A%3Cellipse%20fill%3D%22none%22%20stroke%3D%22%23000000%22%20cx%3D%2227.9475%22%20cy%3D%22-90%22%20rx%3D%2227.8951%22%20ry%3D%2218%22%2F%3E%0A%3Ctext%20text-anchor%3D%22middle%22%20x%3D%2227.9475%22%20y%3D%22-86.3%22%20font-family%3D%22Times%2Cserif%22%20font-size%3D%2214.00%22%20fill%3D%22%23000000%22%3ESAT%3C%2Ftext%3E%0A%3C%2Fg%3E%0A%3C!--%20Intel%26%2345%3B%26gt%3BSAT%20--%3E%0A%3Cg%20id%3D%22edge4%22%20class%3D%22edge%22%3E%0A%3Ctitle%3EIntel%26%2345%3B%26gt%3BSAT%3C%2Ftitle%3E%0A%3Cpath%20fill%3D%22none%22%20stroke%3D%22%23000000%22%20d%3D%22M30.1905%2C-143.8314C29.8696%2C-136.131%2029.4881%2C-126.9743%2029.1315%2C-118.4166%22%2F%3E%0A%3Cpolygon%20fill%3D%22%23000000%22%20stroke%3D%22%23000000%22%20points%3D%2232.6281%2C-118.2589%2028.7147%2C-108.4133%2025.6342%2C-118.5503%2032.6281%2C-118.2589%22%2F%3E%0A%3C%2Fg%3E%0A%3C!--%20Grade%20--%3E%0A%3Cg%20id%3D%22node4%22%20class%3D%22node%22%3E%0A%3Ctitle%3EGrade%3C%2Ftitle%3E%0A%3Cellipse%20fill%3D%22none%22%20stroke%3D%22%23000000%22%20cx%3D%22106.9475%22%20cy%3D%22-90%22%20rx%3D%2233.2948%22%20ry%3D%2218%22%2F%3E%0A%3Ctext%20text-anchor%3D%22middle%22%20x%3D%22106.9475%22%20y%3D%22-86.3%22%20font-family%3D%22Times%2Cserif%22%20font-size%3D%2214.00%22%20fill%3D%22%23000000%22%3EGrade%3C%2Ftext%3E%0A%3C%2Fg%3E%0A%3C!--%20Intel%26%2345%3B%26gt%3BGrade%20--%3E%0A%3Cg%20id%3D%22edge3%22%20class%3D%22edge%22%3E%0A%3Ctitle%3EIntel%26%2345%3B%26gt%3BGrade%3C%2Ftitle%3E%0A%3Cpath%20fill%3D%22none%22%20stroke%3D%22%23000000%22%20d%3D%22M46.6948%2C-147.0816C57.1805%2C-137.1477%2071.1566%2C-123.9072%2083.0083%2C-112.6793%22%2F%3E%0A%3Cpolygon%20fill%3D%22%23000000%22%20stroke%3D%22%23000000%22%20points%3D%2285.5793%2C-115.0648%2090.4318%2C-105.6465%2080.7651%2C-109.9831%2085.5793%2C-115.0648%22%2F%3E%0A%3C%2Fg%3E%0A%3C!--%20Grade%26%2345%3B%26gt%3BLetter%20--%3E%0A%3Cg%20id%3D%22edge2%22%20class%3D%22edge%22%3E%0A%3Ctitle%3EGrade%26%2345%3B%26gt%3BLetter%3C%2Ftitle%3E%0A%3Cpath%20fill%3D%22none%22%20stroke%3D%22%23000000%22%20d%3D%22M106.9475%2C-71.8314C106.9475%2C-64.131%20106.9475%2C-54.9743%20106.9475%2C-46.4166%22%2F%3E%0A%3Cpolygon%20fill%3D%22%23000000%22%20stroke%3D%22%23000000%22%20points%3D%22110.4476%2C-46.4132%20106.9475%2C-36.4133%20103.4476%2C-46.4133%20110.4476%2C-46.4132%22%2F%3E%0A%3C%2Fg%3E%0A%3C!--%20Diff%20--%3E%0A%3Cg%20id%3D%22node5%22%20class%3D%22node%22%3E%0A%3Ctitle%3EDiff%3C%2Ftitle%3E%0A%3Cellipse%20fill%3D%22none%22%20stroke%3D%22%23000000%22%20cx%3D%22106.9475%22%20cy%3D%22-162%22%20rx%3D%2227%22%20ry%3D%2218%22%2F%3E%0A%3Ctext%20text-anchor%3D%22middle%22%20x%3D%22106.9475%22%20y%3D%22-158.3%22%20font-family%3D%22Times%2Cserif%22%20font-size%3D%2214.00%22%20fill%3D%22%23000000%22%3EDiff%3C%2Ftext%3E%0A%3C%2Fg%3E%0A%3C!--%20Diff%26%2345%3B%26gt%3BGrade%20--%3E%0A%3Cg%20id%3D%22edge1%22%20class%3D%22edge%22%3E%0A%3Ctitle%3EDiff%26%2345%3B%26gt%3BGrade%3C%2Ftitle%3E%0A%3Cpath%20fill%3D%22none%22%20stroke%3D%22%23000000%22%20d%3D%22M106.9475%2C-143.8314C106.9475%2C-136.131%20106.9475%2C-126.9743%20106.9475%2C-118.4166%22%2F%3E%0A%3Cpolygon%20fill%3D%22%23000000%22%20stroke%3D%22%23000000%22%20points%3D%22110.4476%2C-118.4132%20106.9475%2C-108.4133%20103.4476%2C-118.4133%20110.4476%2C-118.4132%22%2F%3E%0A%3C%2Fg%3E%0A%3C%2Fg%3E%0A%3C%2Fsvg%3E%0A)
'student_pgm.pdf'
In [7]:
CPTs
In [8]:
Out[8]:
%0A%20--%3E%0A%3C!--%20Title%3A%20model_%20Pages%3A%201%20--%3E%0A%3Csvg%20width%3D%22502pt%22%20height%3D%22586pt%22%0A%20viewBox%3D%220.00%200.00%20501.59%20586.29%22%20xmlns%3D%22http%3A%2F%2Fwww.w3.org%2F2000%2Fsvg%22%20xmlns%3Axlink%3D%22http%3A%2F%2Fwww.w3.org%2F1999%2Fxlink%22%3E%0A%3Cg%20id%3D%22graph0%22%20class%3D%22graph%22%20transform%3D%22scale(1%201)%20rotate(0)%20translate(4%20582.2885)%22%3E%0A%3Ctitle%3Emodel_%3C%2Ftitle%3E%0A%3Cpolygon%20fill%3D%22%23ffffff%22%20stroke%3D%22transparent%22%20points%3D%22-4%2C4%20-4%2C-582.2885%20497.5879%2C-582.2885%20497.5879%2C4%20-4%2C4%22%2F%3E%0A%3C!--%20Diff%20--%3E%0A%3Cg%20id%3D%22node1%22%20class%3D%22node%22%3E%0A%3Ctitle%3EDiff%3C%2Ftitle%3E%0A%3Cellipse%20fill%3D%22none%22%20stroke%3D%22%23000000%22%20cx%3D%22142.1285%22%20cy%3D%22-521.0128%22%20rx%3D%2265.5227%22%20ry%3D%2257.0522%22%2F%3E%0A%3Cpolygon%20fill%3D%22none%22%20stroke%3D%22%23000000%22%20points%3D%22107.1285%2C-533.0128%20107.1285%2C-554.0128%20178.1285%2C-554.0128%20178.1285%2C-533.0128%20107.1285%2C-533.0128%22%2F%3E%0A%3Ctext%20text-anchor%3D%22start%22%20x%3D%22127.1285%22%20y%3D%22-539.8128%22%20font-family%3D%22Times%2Cserif%22%20font-size%3D%2214.00%22%20fill%3D%22%23000000%22%3E%20Diff%20%3C%2Ftext%3E%0A%3Cpolygon%20fill%3D%22none%22%20stroke%3D%22%23000000%22%20points%3D%22107.1285%2C-510.0128%20107.1285%2C-531.0128%20141.1285%2C-531.0128%20141.1285%2C-510.0128%20107.1285%2C-510.0128%22%2F%3E%0A%3Ctext%20text-anchor%3D%22start%22%20x%3D%22110.1285%22%20y%3D%22-516.8128%22%20font-family%3D%22Times%2Cserif%22%20font-size%3D%2214.00%22%20fill%3D%22%23000000%22%3EEasy%3C%2Ftext%3E%0A%3Cpolygon%20fill%3D%22none%22%20stroke%3D%22%23000000%22%20points%3D%22143.1285%2C-510.0128%20143.1285%2C-531.0128%20178.1285%2C-531.0128%20178.1285%2C-510.0128%20143.1285%2C-510.0128%22%2F%3E%0A%3Ctext%20text-anchor%3D%22start%22%20x%3D%22146.1285%22%20y%3D%22-516.8128%22%20font-family%3D%22Times%2Cserif%22%20font-size%3D%2214.00%22%20fill%3D%22%23000000%22%3EHard%3C%2Ftext%3E%0A%3Cpolygon%20fill%3D%22none%22%20stroke%3D%22%23000000%22%20points%3D%22107.1285%2C-487.0128%20107.1285%2C-508.0128%20141.1285%2C-508.0128%20141.1285%2C-487.0128%20107.1285%2C-487.0128%22%2F%3E%0A%3Ctext%20text-anchor%3D%22start%22%20x%3D%22110.6285%22%20y%3D%22-493.8128%22%20font-family%3D%22Times%2Cserif%22%20font-size%3D%2214.00%22%20fill%3D%22%23000000%22%3E0.60%3C%2Ftext%3E%0A%3Cpolygon%20fill%3D%22none%22%20stroke%3D%22%23000000%22%20points%3D%22143.1285%2C-487.0128%20143.1285%2C-508.0128%20178.1285%2C-508.0128%20178.1285%2C-487.0128%20143.1285%2C-487.0128%22%2F%3E%0A%3Ctext%20text-anchor%3D%22start%22%20x%3D%22147.1285%22%20y%3D%22-493.8128%22%20font-family%3D%22Times%2Cserif%22%20font-size%3D%2214.00%22%20fill%3D%22%23000000%22%3E0.40%3C%2Ftext%3E%0A%3Cpolygon%20fill%3D%22none%22%20stroke%3D%22%23000000%22%20points%3D%22103.6285%2C-484.5128%20103.6285%2C-557.5128%20180.6285%2C-557.5128%20180.6285%2C-484.5128%20103.6285%2C-484.5128%22%2F%3E%0A%3C%2Fg%3E%0A%3C!--%20Grade%20--%3E%0A%3Cg%20id%3D%22node3%22%20class%3D%22node%22%3E%0A%3Ctitle%3EGrade%3C%2Ftitle%3E%0A%3Cellipse%20fill%3D%22none%22%20stroke%3D%22%23000000%22%20cx%3D%22142.1285%22%20cy%3D%22-321.6711%22%20rx%3D%22142.257%22%20ry%3D%22106.1321%22%2F%3E%0A%3Cpolygon%20fill%3D%22none%22%20stroke%3D%22%23000000%22%20points%3D%2253.1285%2C-368.6711%2053.1285%2C-389.6711%20232.1285%2C-389.6711%20232.1285%2C-368.6711%2053.1285%2C-368.6711%22%2F%3E%0A%3Ctext%20text-anchor%3D%22start%22%20x%3D%22121.1285%22%20y%3D%22-375.4711%22%20font-family%3D%22Times%2Cserif%22%20font-size%3D%2214.00%22%20fill%3D%22%23000000%22%3E%20Grade%20%3C%2Ftext%3E%0A%3Cpolygon%20fill%3D%22none%22%20stroke%3D%22%23000000%22%20points%3D%2253.1285%2C-345.6711%2053.1285%2C-366.6711%20125.1285%2C-366.6711%20125.1285%2C-345.6711%2053.1285%2C-345.6711%22%2F%3E%0A%3Ctext%20text-anchor%3D%22start%22%20x%3D%2287.1285%22%20y%3D%22-352.4711%22%20font-family%3D%22Times%2Cserif%22%20font-size%3D%2214.00%22%20fill%3D%22%23000000%22%3E%20%3C%2Ftext%3E%0A%3Cpolygon%20fill%3D%22none%22%20stroke%3D%22%23000000%22%20points%3D%22127.1285%2C-345.6711%20127.1285%2C-366.6711%20160.1285%2C-366.6711%20160.1285%2C-345.6711%20127.1285%2C-345.6711%22%2F%3E%0A%3Ctext%20text-anchor%3D%22start%22%20x%3D%22138.1285%22%20y%3D%22-352.4711%22%20font-family%3D%22Times%2Cserif%22%20font-size%3D%2214.00%22%20fill%3D%22%23000000%22%3EA%3C%2Ftext%3E%0A%3Cpolygon%20fill%3D%22none%22%20stroke%3D%22%23000000%22%20points%3D%22162.1285%2C-345.6711%20162.1285%2C-366.6711%20195.1285%2C-366.6711%20195.1285%2C-345.6711%20162.1285%2C-345.6711%22%2F%3E%0A%3Ctext%20text-anchor%3D%22start%22%20x%3D%22173.6285%22%20y%3D%22-352.4711%22%20font-family%3D%22Times%2Cserif%22%20font-size%3D%2214.00%22%20fill%3D%22%23000000%22%3EB%3C%2Ftext%3E%0A%3Cpolygon%20fill%3D%22none%22%20stroke%3D%22%23000000%22%20points%3D%22197.1285%2C-345.6711%20197.1285%2C-366.6711%20230.1285%2C-366.6711%20230.1285%2C-345.6711%20197.1285%2C-345.6711%22%2F%3E%0A%3Ctext%20text-anchor%3D%22start%22%20x%3D%22208.6285%22%20y%3D%22-352.4711%22%20font-family%3D%22Times%2Cserif%22%20font-size%3D%2214.00%22%20fill%3D%22%23000000%22%3EC%3C%2Ftext%3E%0A%3Cpolygon%20fill%3D%22none%22%20stroke%3D%22%23000000%22%20points%3D%2253.1285%2C-322.6711%2053.1285%2C-343.6711%20125.1285%2C-343.6711%20125.1285%2C-322.6711%2053.1285%2C-322.6711%22%2F%3E%0A%3Ctext%20text-anchor%3D%22start%22%20x%3D%2258.1285%22%20y%3D%22-329.4711%22%20font-family%3D%22Times%2Cserif%22%20font-size%3D%2214.00%22%20fill%3D%22%23000000%22%3ELow%2C%20Easy%3C%2Ftext%3E%0A%3Cpolygon%20fill%3D%22none%22%20stroke%3D%22%23000000%22%20points%3D%22127.1285%2C-322.6711%20127.1285%2C-343.6711%20160.1285%2C-343.6711%20160.1285%2C-322.6711%20127.1285%2C-322.6711%22%2F%3E%0A%3Ctext%20text-anchor%3D%22start%22%20x%3D%22130.1285%22%20y%3D%22-329.4711%22%20font-family%3D%22Times%2Cserif%22%20font-size%3D%2214.00%22%20fill%3D%22%23000000%22%3E0.30%3C%2Ftext%3E%0A%3Cpolygon%20fill%3D%22none%22%20stroke%3D%22%23000000%22%20points%3D%22162.1285%2C-322.6711%20162.1285%2C-343.6711%20195.1285%2C-343.6711%20195.1285%2C-322.6711%20162.1285%2C-322.6711%22%2F%3E%0A%3Ctext%20text-anchor%3D%22start%22%20x%3D%22165.1285%22%20y%3D%22-329.4711%22%20font-family%3D%22Times%2Cserif%22%20font-size%3D%2214.00%22%20fill%3D%22%23000000%22%3E0.40%3C%2Ftext%3E%0A%3Cpolygon%20fill%3D%22none%22%20stroke%3D%22%23000000%22%20points%3D%22197.1285%2C-322.6711%20197.1285%2C-343.6711%20230.1285%2C-343.6711%20230.1285%2C-322.6711%20197.1285%2C-322.6711%22%2F%3E%0A%3Ctext%20text-anchor%3D%22start%22%20x%3D%22200.1285%22%20y%3D%22-329.4711%22%20font-family%3D%22Times%2Cserif%22%20font-size%3D%2214.00%22%20fill%3D%22%23000000%22%3E0.30%3C%2Ftext%3E%0A%3Cpolygon%20fill%3D%22none%22%20stroke%3D%22%23000000%22%20points%3D%2253.1285%2C-299.6711%2053.1285%2C-320.6711%20125.1285%2C-320.6711%20125.1285%2C-299.6711%2053.1285%2C-299.6711%22%2F%3E%0A%3Ctext%20text-anchor%3D%22start%22%20x%3D%2257.6285%22%20y%3D%22-306.4711%22%20font-family%3D%22Times%2Cserif%22%20font-size%3D%2214.00%22%20fill%3D%22%23000000%22%3ELow%2C%20Hard%3C%2Ftext%3E%0A%3Cpolygon%20fill%3D%22none%22%20stroke%3D%22%23000000%22%20points%3D%22127.1285%2C-299.6711%20127.1285%2C-320.6711%20160.1285%2C-320.6711%20160.1285%2C-299.6711%20127.1285%2C-299.6711%22%2F%3E%0A%3Ctext%20text-anchor%3D%22start%22%20x%3D%22130.1285%22%20y%3D%22-306.4711%22%20font-family%3D%22Times%2Cserif%22%20font-size%3D%2214.00%22%20fill%3D%22%23000000%22%3E0.05%3C%2Ftext%3E%0A%3Cpolygon%20fill%3D%22none%22%20stroke%3D%22%23000000%22%20points%3D%22162.1285%2C-299.6711%20162.1285%2C-320.6711%20195.1285%2C-320.6711%20195.1285%2C-299.6711%20162.1285%2C-299.6711%22%2F%3E%0A%3Ctext%20text-anchor%3D%22start%22%20x%3D%22165.1285%22%20y%3D%22-306.4711%22%20font-family%3D%22Times%2Cserif%22%20font-size%3D%2214.00%22%20fill%3D%22%23000000%22%3E0.25%3C%2Ftext%3E%0A%3Cpolygon%20fill%3D%22none%22%20stroke%3D%22%23000000%22%20points%3D%22197.1285%2C-299.6711%20197.1285%2C-320.6711%20230.1285%2C-320.6711%20230.1285%2C-299.6711%20197.1285%2C-299.6711%22%2F%3E%0A%3Ctext%20text-anchor%3D%22start%22%20x%3D%22200.1285%22%20y%3D%22-306.4711%22%20font-family%3D%22Times%2Cserif%22%20font-size%3D%2214.00%22%20fill%3D%22%23000000%22%3E0.70%3C%2Ftext%3E%0A%3Cpolygon%20fill%3D%22none%22%20stroke%3D%22%23000000%22%20points%3D%2253.1285%2C-276.6711%2053.1285%2C-297.6711%20125.1285%2C-297.6711%20125.1285%2C-276.6711%2053.1285%2C-276.6711%22%2F%3E%0A%3Ctext%20text-anchor%3D%22start%22%20x%3D%2256.6285%22%20y%3D%22-283.4711%22%20font-family%3D%22Times%2Cserif%22%20font-size%3D%2214.00%22%20fill%3D%22%23000000%22%3EHigh%2C%20Easy%3C%2Ftext%3E%0A%3Cpolygon%20fill%3D%22none%22%20stroke%3D%22%23000000%22%20points%3D%22127.1285%2C-276.6711%20127.1285%2C-297.6711%20160.1285%2C-297.6711%20160.1285%2C-276.6711%20127.1285%2C-276.6711%22%2F%3E%0A%3Ctext%20text-anchor%3D%22start%22%20x%3D%22130.1285%22%20y%3D%22-283.4711%22%20font-family%3D%22Times%2Cserif%22%20font-size%3D%2214.00%22%20fill%3D%22%23000000%22%3E0.90%3C%2Ftext%3E%0A%3Cpolygon%20fill%3D%22none%22%20stroke%3D%22%23000000%22%20points%3D%22162.1285%2C-276.6711%20162.1285%2C-297.6711%20195.1285%2C-297.6711%20195.1285%2C-276.6711%20162.1285%2C-276.6711%22%2F%3E%0A%3Ctext%20text-anchor%3D%22start%22%20x%3D%22165.1285%22%20y%3D%22-283.4711%22%20font-family%3D%22Times%2Cserif%22%20font-size%3D%2214.00%22%20fill%3D%22%23000000%22%3E0.08%3C%2Ftext%3E%0A%3Cpolygon%20fill%3D%22none%22%20stroke%3D%22%23000000%22%20points%3D%22197.1285%2C-276.6711%20197.1285%2C-297.6711%20230.1285%2C-297.6711%20230.1285%2C-276.6711%20197.1285%2C-276.6711%22%2F%3E%0A%3Ctext%20text-anchor%3D%22start%22%20x%3D%22200.1285%22%20y%3D%22-283.4711%22%20font-family%3D%22Times%2Cserif%22%20font-size%3D%2214.00%22%20fill%3D%22%23000000%22%3E0.02%3C%2Ftext%3E%0A%3Cpolygon%20fill%3D%22none%22%20stroke%3D%22%23000000%22%20points%3D%2253.1285%2C-253.6711%2053.1285%2C-274.6711%20125.1285%2C-274.6711%20125.1285%2C-253.6711%2053.1285%2C-253.6711%22%2F%3E%0A%3Ctext%20text-anchor%3D%22start%22%20x%3D%2256.1285%22%20y%3D%22-260.4711%22%20font-family%3D%22Times%2Cserif%22%20font-size%3D%2214.00%22%20fill%3D%22%23000000%22%3EHigh%2C%20Hard%3C%2Ftext%3E%0A%3Cpolygon%20fill%3D%22none%22%20stroke%3D%22%23000000%22%20points%3D%22127.1285%2C-253.6711%20127.1285%2C-274.6711%20160.1285%2C-274.6711%20160.1285%2C-253.6711%20127.1285%2C-253.6711%22%2F%3E%0A%3Ctext%20text-anchor%3D%22start%22%20x%3D%22130.1285%22%20y%3D%22-260.4711%22%20font-family%3D%22Times%2Cserif%22%20font-size%3D%2214.00%22%20fill%3D%22%23000000%22%3E0.50%3C%2Ftext%3E%0A%3Cpolygon%20fill%3D%22none%22%20stroke%3D%22%23000000%22%20points%3D%22162.1285%2C-253.6711%20162.1285%2C-274.6711%20195.1285%2C-274.6711%20195.1285%2C-253.6711%20162.1285%2C-253.6711%22%2F%3E%0A%3Ctext%20text-anchor%3D%22start%22%20x%3D%22165.1285%22%20y%3D%22-260.4711%22%20font-family%3D%22Times%2Cserif%22%20font-size%3D%2214.00%22%20fill%3D%22%23000000%22%3E0.30%3C%2Ftext%3E%0A%3Cpolygon%20fill%3D%22none%22%20stroke%3D%22%23000000%22%20points%3D%22197.1285%2C-253.6711%20197.1285%2C-274.6711%20230.1285%2C-274.6711%20230.1285%2C-253.6711%20197.1285%2C-253.6711%22%2F%3E%0A%3Ctext%20text-anchor%3D%22start%22%20x%3D%22200.1285%22%20y%3D%22-260.4711%22%20font-family%3D%22Times%2Cserif%22%20font-size%3D%2214.00%22%20fill%3D%22%23000000%22%3E0.20%3C%2Ftext%3E%0A%3Cpolygon%20fill%3D%22none%22%20stroke%3D%22%23000000%22%20points%3D%2249.6285%2C-250.6711%2049.6285%2C-392.6711%20234.6285%2C-392.6711%20234.6285%2C-250.6711%2049.6285%2C-250.6711%22%2F%3E%0A%3C%2Fg%3E%0A%3C!--%20Diff%26%2345%3B%26gt%3BGrade%20--%3E%0A%3Cg%20id%3D%22edge1%22%20class%3D%22edge%22%3E%0A%3Ctitle%3EDiff%26%2345%3B%26gt%3BGrade%3C%2Ftitle%3E%0A%3Cpath%20fill%3D%22none%22%20stroke%3D%22%23000000%22%20d%3D%22M142.1285%2C-463.6224C142.1285%2C-455.4327%20142.1285%2C-446.7755%20142.1285%2C-437.9393%22%2F%3E%0A%3Cpolygon%20fill%3D%22%23000000%22%20stroke%3D%22%23000000%22%20points%3D%22145.6286%2C-437.9021%20142.1285%2C-427.9022%20138.6286%2C-437.9022%20145.6286%2C-437.9021%22%2F%3E%0A%3C%2Fg%3E%0A%3C!--%20Intel%20--%3E%0A%3Cg%20id%3D%22node2%22%20class%3D%22node%22%3E%0A%3Ctitle%3EIntel%3C%2Ftitle%3E%0A%3Cellipse%20fill%3D%22none%22%20stroke%3D%22%23000000%22%20cx%3D%22345.1285%22%20cy%3D%22-521.0128%22%20rx%3D%2266.4361%22%20ry%3D%2257.0522%22%2F%3E%0A%3Cpolygon%20fill%3D%22none%22%20stroke%3D%22%23000000%22%20points%3D%22309.1285%2C-533.0128%20309.1285%2C-554.0128%20381.1285%2C-554.0128%20381.1285%2C-533.0128%20309.1285%2C-533.0128%22%2F%3E%0A%3Ctext%20text-anchor%3D%22start%22%20x%3D%22328.1285%22%20y%3D%22-539.8128%22%20font-family%3D%22Times%2Cserif%22%20font-size%3D%2214.00%22%20fill%3D%22%23000000%22%3E%20Intel%20%3C%2Ftext%3E%0A%3Cpolygon%20fill%3D%22none%22%20stroke%3D%22%23000000%22%20points%3D%22309.1285%2C-510.0128%20309.1285%2C-531.0128%20343.1285%2C-531.0128%20343.1285%2C-510.0128%20309.1285%2C-510.0128%22%2F%3E%0A%3Ctext%20text-anchor%3D%22start%22%20x%3D%22312.1285%22%20y%3D%22-516.8128%22%20font-family%3D%22Times%2Cserif%22%20font-size%3D%2214.00%22%20fill%3D%22%23000000%22%3ELow%3C%2Ftext%3E%0A%3Cpolygon%20fill%3D%22none%22%20stroke%3D%22%23000000%22%20points%3D%22345.1285%2C-510.0128%20345.1285%2C-531.0128%20381.1285%2C-531.0128%20381.1285%2C-510.0128%20345.1285%2C-510.0128%22%2F%3E%0A%3Ctext%20text-anchor%3D%22start%22%20x%3D%22348.1285%22%20y%3D%22-516.8128%22%20font-family%3D%22Times%2Cserif%22%20font-size%3D%2214.00%22%20fill%3D%22%23000000%22%3EHigh%3C%2Ftext%3E%0A%3Cpolygon%20fill%3D%22none%22%20stroke%3D%22%23000000%22%20points%3D%22309.1285%2C-487.0128%20309.1285%2C-508.0128%20343.1285%2C-508.0128%20343.1285%2C-487.0128%20309.1285%2C-487.0128%22%2F%3E%0A%3Ctext%20text-anchor%3D%22start%22%20x%3D%22312.6285%22%20y%3D%22-493.8128%22%20font-family%3D%22Times%2Cserif%22%20font-size%3D%2214.00%22%20fill%3D%22%23000000%22%3E0.70%3C%2Ftext%3E%0A%3Cpolygon%20fill%3D%22none%22%20stroke%3D%22%23000000%22%20points%3D%22345.1285%2C-487.0128%20345.1285%2C-508.0128%20381.1285%2C-508.0128%20381.1285%2C-487.0128%20345.1285%2C-487.0128%22%2F%3E%0A%3Ctext%20text-anchor%3D%22start%22%20x%3D%22349.6285%22%20y%3D%22-493.8128%22%20font-family%3D%22Times%2Cserif%22%20font-size%3D%2214.00%22%20fill%3D%22%23000000%22%3E0.30%3C%2Ftext%3E%0A%3Cpolygon%20fill%3D%22none%22%20stroke%3D%22%23000000%22%20points%3D%22306.1285%2C-484.5128%20306.1285%2C-557.5128%20384.1285%2C-557.5128%20384.1285%2C-484.5128%20306.1285%2C-484.5128%22%2F%3E%0A%3C%2Fg%3E%0A%3C!--%20Intel%26%2345%3B%26gt%3BGrade%20--%3E%0A%3Cg%20id%3D%22edge3%22%20class%3D%22edge%22%3E%0A%3Ctitle%3EIntel%26%2345%3B%26gt%3BGrade%3C%2Ftitle%3E%0A%3Cpath%20fill%3D%22none%22%20stroke%3D%22%23000000%22%20d%3D%22M301.0805%2C-477.7586C281.8249%2C-458.8501%20258.4561%2C-435.9024%20235.6301%2C-413.4877%22%2F%3E%0A%3Cpolygon%20fill%3D%22%23000000%22%20stroke%3D%22%23000000%22%20points%3D%22237.8314%2C-410.744%20228.244%2C-406.2348%20232.9268%2C-415.7386%20237.8314%2C-410.744%22%2F%3E%0A%3C%2Fg%3E%0A%3C!--%20SAT%20--%3E%0A%3Cg%20id%3D%22node5%22%20class%3D%22node%22%3E%0A%3Ctitle%3ESAT%3C%2Ftitle%3E%0A%3Cellipse%20fill%3D%22none%22%20stroke%3D%22%23000000%22%20cx%3D%22398.1285%22%20cy%3D%22-321.6711%22%20rx%3D%2295.4188%22%20ry%3D%2273.5782%22%2F%3E%0A%3Cpolygon%20fill%3D%22none%22%20stroke%3D%22%23000000%22%20points%3D%22342.1285%2C-345.6711%20342.1285%2C-366.6711%20455.1285%2C-366.6711%20455.1285%2C-345.6711%20342.1285%2C-345.6711%22%2F%3E%0A%3Ctext%20text-anchor%3D%22start%22%20x%3D%22381.6285%22%20y%3D%22-352.4711%22%20font-family%3D%22Times%2Cserif%22%20font-size%3D%2214.00%22%20fill%3D%22%23000000%22%3E%20SAT%20%3C%2Ftext%3E%0A%3Cpolygon%20fill%3D%22none%22%20stroke%3D%22%23000000%22%20points%3D%22342.1285%2C-322.6711%20342.1285%2C-343.6711%20378.1285%2C-343.6711%20378.1285%2C-322.6711%20342.1285%2C-322.6711%22%2F%3E%0A%3Ctext%20text-anchor%3D%22start%22%20x%3D%22358.1285%22%20y%3D%22-329.4711%22%20font-family%3D%22Times%2Cserif%22%20font-size%3D%2214.00%22%20fill%3D%22%23000000%22%3E%20%3C%2Ftext%3E%0A%3Cpolygon%20fill%3D%22none%22%20stroke%3D%22%23000000%22%20points%3D%22380.1285%2C-322.6711%20380.1285%2C-343.6711%20413.1285%2C-343.6711%20413.1285%2C-322.6711%20380.1285%2C-322.6711%22%2F%3E%0A%3Ctext%20text-anchor%3D%22start%22%20x%3D%22384.6285%22%20y%3D%22-329.4711%22%20font-family%3D%22Times%2Cserif%22%20font-size%3D%2214.00%22%20fill%3D%22%23000000%22%3EBad%3C%2Ftext%3E%0A%3Cpolygon%20fill%3D%22none%22%20stroke%3D%22%23000000%22%20points%3D%22415.1285%2C-322.6711%20415.1285%2C-343.6711%20455.1285%2C-343.6711%20455.1285%2C-322.6711%20415.1285%2C-322.6711%22%2F%3E%0A%3Ctext%20text-anchor%3D%22start%22%20x%3D%22418.1285%22%20y%3D%22-329.4711%22%20font-family%3D%22Times%2Cserif%22%20font-size%3D%2214.00%22%20fill%3D%22%23000000%22%3EGood%3C%2Ftext%3E%0A%3Cpolygon%20fill%3D%22none%22%20stroke%3D%22%23000000%22%20points%3D%22342.1285%2C-299.6711%20342.1285%2C-320.6711%20378.1285%2C-320.6711%20378.1285%2C-299.6711%20342.1285%2C-299.6711%22%2F%3E%0A%3Ctext%20text-anchor%3D%22start%22%20x%3D%22346.1285%22%20y%3D%22-306.4711%22%20font-family%3D%22Times%2Cserif%22%20font-size%3D%2214.00%22%20fill%3D%22%23000000%22%3ELow%3C%2Ftext%3E%0A%3Cpolygon%20fill%3D%22none%22%20stroke%3D%22%23000000%22%20points%3D%22380.1285%2C-299.6711%20380.1285%2C-320.6711%20413.1285%2C-320.6711%20413.1285%2C-299.6711%20380.1285%2C-299.6711%22%2F%3E%0A%3Ctext%20text-anchor%3D%22start%22%20x%3D%22383.1285%22%20y%3D%22-306.4711%22%20font-family%3D%22Times%2Cserif%22%20font-size%3D%2214.00%22%20fill%3D%22%23000000%22%3E0.95%3C%2Ftext%3E%0A%3Cpolygon%20fill%3D%22none%22%20stroke%3D%22%23000000%22%20points%3D%22415.1285%2C-299.6711%20415.1285%2C-320.6711%20455.1285%2C-320.6711%20455.1285%2C-299.6711%20415.1285%2C-299.6711%22%2F%3E%0A%3Ctext%20text-anchor%3D%22start%22%20x%3D%22421.6285%22%20y%3D%22-306.4711%22%20font-family%3D%22Times%2Cserif%22%20font-size%3D%2214.00%22%20fill%3D%22%23000000%22%3E0.05%3C%2Ftext%3E%0A%3Cpolygon%20fill%3D%22none%22%20stroke%3D%22%23000000%22%20points%3D%22342.1285%2C-276.6711%20342.1285%2C-297.6711%20378.1285%2C-297.6711%20378.1285%2C-276.6711%20342.1285%2C-276.6711%22%2F%3E%0A%3Ctext%20text-anchor%3D%22start%22%20x%3D%22345.1285%22%20y%3D%22-283.4711%22%20font-family%3D%22Times%2Cserif%22%20font-size%3D%2214.00%22%20fill%3D%22%23000000%22%3EHigh%3C%2Ftext%3E%0A%3Cpolygon%20fill%3D%22none%22%20stroke%3D%22%23000000%22%20points%3D%22380.1285%2C-276.6711%20380.1285%2C-297.6711%20413.1285%2C-297.6711%20413.1285%2C-276.6711%20380.1285%2C-276.6711%22%2F%3E%0A%3Ctext%20text-anchor%3D%22start%22%20x%3D%22383.1285%22%20y%3D%22-283.4711%22%20font-family%3D%22Times%2Cserif%22%20font-size%3D%2214.00%22%20fill%3D%22%23000000%22%3E0.20%3C%2Ftext%3E%0A%3Cpolygon%20fill%3D%22none%22%20stroke%3D%22%23000000%22%20points%3D%22415.1285%2C-276.6711%20415.1285%2C-297.6711%20455.1285%2C-297.6711%20455.1285%2C-276.6711%20415.1285%2C-276.6711%22%2F%3E%0A%3Ctext%20text-anchor%3D%22start%22%20x%3D%22421.6285%22%20y%3D%22-283.4711%22%20font-family%3D%22Times%2Cserif%22%20font-size%3D%2214.00%22%20fill%3D%22%23000000%22%3E0.80%3C%2Ftext%3E%0A%3Cpolygon%20fill%3D%22none%22%20stroke%3D%22%23000000%22%20points%3D%22338.6285%2C-273.6711%20338.6285%2C-369.6711%20457.6285%2C-369.6711%20457.6285%2C-273.6711%20338.6285%2C-273.6711%22%2F%3E%0A%3C%2Fg%3E%0A%3C!--%20Intel%26%2345%3B%26gt%3BSAT%20--%3E%0A%3Cg%20id%3D%22edge4%22%20class%3D%22edge%22%3E%0A%3Ctitle%3EIntel%26%2345%3B%26gt%3BSAT%3C%2Ftitle%3E%0A%3Cpath%20fill%3D%22none%22%20stroke%3D%22%23000000%22%20d%3D%22M360.033%2C-464.9546C365.0814%2C-445.9667%20370.8291%2C-424.3484%20376.3022%2C-403.7632%22%2F%3E%0A%3Cpolygon%20fill%3D%22%23000000%22%20stroke%3D%22%23000000%22%20points%3D%22379.6909%2C-404.6388%20378.878%2C-394.0752%20372.926%2C-402.8401%20379.6909%2C-404.6388%22%2F%3E%0A%3C%2Fg%3E%0A%3C!--%20Letter%20--%3E%0A%3Cg%20id%3D%22node4%22%20class%3D%22node%22%3E%0A%3Ctitle%3ELetter%3C%2Ftitle%3E%0A%3Cellipse%20fill%3D%22none%22%20stroke%3D%22%23000000%22%20cx%3D%22142.1285%22%20cy%3D%22-89.8026%22%20rx%3D%2283.3772%22%20ry%3D%2289.6056%22%2F%3E%0A%3Cpolygon%20fill%3D%22none%22%20stroke%3D%22%23000000%22%20points%3D%2294.1285%2C-124.8026%2094.1285%2C-145.8026%20190.1285%2C-145.8026%20190.1285%2C-124.8026%2094.1285%2C-124.8026%22%2F%3E%0A%3Ctext%20text-anchor%3D%22start%22%20x%3D%22121.6285%22%20y%3D%22-131.6026%22%20font-family%3D%22Times%2Cserif%22%20font-size%3D%2214.00%22%20fill%3D%22%23000000%22%3E%20Letter%20%3C%2Ftext%3E%0A%3Cpolygon%20fill%3D%22none%22%20stroke%3D%22%23000000%22%20points%3D%2294.1285%2C-101.8026%2094.1285%2C-122.8026%20111.1285%2C-122.8026%20111.1285%2C-101.8026%2094.1285%2C-101.8026%22%2F%3E%0A%3Ctext%20text-anchor%3D%22start%22%20x%3D%22100.6285%22%20y%3D%22-108.6026%22%20font-family%3D%22Times%2Cserif%22%20font-size%3D%2214.00%22%20fill%3D%22%23000000%22%3E%20%3C%2Ftext%3E%0A%3Cpolygon%20fill%3D%22none%22%20stroke%3D%22%23000000%22%20points%3D%22113.1285%2C-101.8026%20113.1285%2C-122.8026%20146.1285%2C-122.8026%20146.1285%2C-101.8026%20113.1285%2C-101.8026%22%2F%3E%0A%3Ctext%20text-anchor%3D%22start%22%20x%3D%22117.6285%22%20y%3D%22-108.6026%22%20font-family%3D%22Times%2Cserif%22%20font-size%3D%2214.00%22%20fill%3D%22%23000000%22%3EBad%3C%2Ftext%3E%0A%3Cpolygon%20fill%3D%22none%22%20stroke%3D%22%23000000%22%20points%3D%22148.1285%2C-101.8026%20148.1285%2C-122.8026%20188.1285%2C-122.8026%20188.1285%2C-101.8026%20148.1285%2C-101.8026%22%2F%3E%0A%3Ctext%20text-anchor%3D%22start%22%20x%3D%22151.1285%22%20y%3D%22-108.6026%22%20font-family%3D%22Times%2Cserif%22%20font-size%3D%2214.00%22%20fill%3D%22%23000000%22%3EGood%3C%2Ftext%3E%0A%3Cpolygon%20fill%3D%22none%22%20stroke%3D%22%23000000%22%20points%3D%2294.1285%2C-78.8026%2094.1285%2C-99.8026%20111.1285%2C-99.8026%20111.1285%2C-78.8026%2094.1285%2C-78.8026%22%2F%3E%0A%3Ctext%20text-anchor%3D%22start%22%20x%3D%2297.1285%22%20y%3D%22-85.6026%22%20font-family%3D%22Times%2Cserif%22%20font-size%3D%2214.00%22%20fill%3D%22%23000000%22%3EA%3C%2Ftext%3E%0A%3Cpolygon%20fill%3D%22none%22%20stroke%3D%22%23000000%22%20points%3D%22113.1285%2C-78.8026%20113.1285%2C-99.8026%20146.1285%2C-99.8026%20146.1285%2C-78.8026%20113.1285%2C-78.8026%22%2F%3E%0A%3Ctext%20text-anchor%3D%22start%22%20x%3D%22116.1285%22%20y%3D%22-85.6026%22%20font-family%3D%22Times%2Cserif%22%20font-size%3D%2214.00%22%20fill%3D%22%23000000%22%3E0.10%3C%2Ftext%3E%0A%3Cpolygon%20fill%3D%22none%22%20stroke%3D%22%23000000%22%20points%3D%22148.1285%2C-78.8026%20148.1285%2C-99.8026%20188.1285%2C-99.8026%20188.1285%2C-78.8026%20148.1285%2C-78.8026%22%2F%3E%0A%3Ctext%20text-anchor%3D%22start%22%20x%3D%22154.6285%22%20y%3D%22-85.6026%22%20font-family%3D%22Times%2Cserif%22%20font-size%3D%2214.00%22%20fill%3D%22%23000000%22%3E0.90%3C%2Ftext%3E%0A%3Cpolygon%20fill%3D%22none%22%20stroke%3D%22%23000000%22%20points%3D%2294.1285%2C-55.8026%2094.1285%2C-76.8026%20111.1285%2C-76.8026%20111.1285%2C-55.8026%2094.1285%2C-55.8026%22%2F%3E%0A%3Ctext%20text-anchor%3D%22start%22%20x%3D%2297.6285%22%20y%3D%22-62.6026%22%20font-family%3D%22Times%2Cserif%22%20font-size%3D%2214.00%22%20fill%3D%22%23000000%22%3EB%3C%2Ftext%3E%0A%3Cpolygon%20fill%3D%22none%22%20stroke%3D%22%23000000%22%20points%3D%22113.1285%2C-55.8026%20113.1285%2C-76.8026%20146.1285%2C-76.8026%20146.1285%2C-55.8026%20113.1285%2C-55.8026%22%2F%3E%0A%3Ctext%20text-anchor%3D%22start%22%20x%3D%22116.1285%22%20y%3D%22-62.6026%22%20font-family%3D%22Times%2Cserif%22%20font-size%3D%2214.00%22%20fill%3D%22%23000000%22%3E0.40%3C%2Ftext%3E%0A%3Cpolygon%20fill%3D%22none%22%20stroke%3D%22%23000000%22%20points%3D%22148.1285%2C-55.8026%20148.1285%2C-76.8026%20188.1285%2C-76.8026%20188.1285%2C-55.8026%20148.1285%2C-55.8026%22%2F%3E%0A%3Ctext%20text-anchor%3D%22start%22%20x%3D%22154.6285%22%20y%3D%22-62.6026%22%20font-family%3D%22Times%2Cserif%22%20font-size%3D%2214.00%22%20fill%3D%22%23000000%22%3E0.60%3C%2Ftext%3E%0A%3Cpolygon%20fill%3D%22none%22%20stroke%3D%22%23000000%22%20points%3D%2294.1285%2C-32.8026%2094.1285%2C-53.8026%20111.1285%2C-53.8026%20111.1285%2C-32.8026%2094.1285%2C-32.8026%22%2F%3E%0A%3Ctext%20text-anchor%3D%22start%22%20x%3D%2297.6285%22%20y%3D%22-39.6026%22%20font-family%3D%22Times%2Cserif%22%20font-size%3D%2214.00%22%20fill%3D%22%23000000%22%3EC%3C%2Ftext%3E%0A%3Cpolygon%20fill%3D%22none%22%20stroke%3D%22%23000000%22%20points%3D%22113.1285%2C-32.8026%20113.1285%2C-53.8026%20146.1285%2C-53.8026%20146.1285%2C-32.8026%20113.1285%2C-32.8026%22%2F%3E%0A%3Ctext%20text-anchor%3D%22start%22%20x%3D%22116.1285%22%20y%3D%22-39.6026%22%20font-family%3D%22Times%2Cserif%22%20font-size%3D%2214.00%22%20fill%3D%22%23000000%22%3E0.99%3C%2Ftext%3E%0A%3Cpolygon%20fill%3D%22none%22%20stroke%3D%22%23000000%22%20points%3D%22148.1285%2C-32.8026%20148.1285%2C-53.8026%20188.1285%2C-53.8026%20188.1285%2C-32.8026%20148.1285%2C-32.8026%22%2F%3E%0A%3Ctext%20text-anchor%3D%22start%22%20x%3D%22154.6285%22%20y%3D%22-39.6026%22%20font-family%3D%22Times%2Cserif%22%20font-size%3D%2214.00%22%20fill%3D%22%23000000%22%3E0.01%3C%2Ftext%3E%0A%3Cpolygon%20fill%3D%22none%22%20stroke%3D%22%23000000%22%20points%3D%2291.1285%2C-30.3026%2091.1285%2C-149.3026%20193.1285%2C-149.3026%20193.1285%2C-30.3026%2091.1285%2C-30.3026%22%2F%3E%0A%3C%2Fg%3E%0A%3C!--%20Grade%26%2345%3B%26gt%3BLetter%20--%3E%0A%3Cg%20id%3D%22edge2%22%20class%3D%22edge%22%3E%0A%3Ctitle%3EGrade%26%2345%3B%26gt%3BLetter%3C%2Ftitle%3E%0A%3Cpath%20fill%3D%22none%22%20stroke%3D%22%23000000%22%20d%3D%22M142.1285%2C-215.5762C142.1285%2C-207.0986%20142.1285%2C-198.5502%20142.1285%2C-190.1143%22%2F%3E%0A%3Cpolygon%20fill%3D%22%23000000%22%20stroke%3D%22%23000000%22%20points%3D%22145.6286%2C-189.8924%20142.1285%2C-179.8924%20138.6286%2C-189.8924%20145.6286%2C-189.8924%22%2F%3E%0A%3C%2Fg%3E%0A%3C%2Fg%3E%0A%3C%2Fsvg%3E%0A)
'student_pgm_with_cpt.pdf'
Marginals
In [ ]:
0%| | 0/1 [00:00<?, ?it/s]
0%| | 0/1 [00:00<?, ?it/s]
0%| | 0/1 [00:00<?, ?it/s]
0%| | 0/1 [00:00<?, ?it/s]
0it [00:00, ?it/s]
0it [00:00, ?it/s]
0%| | 0/2 [00:00<?, ?it/s]
0%| | 0/2 [00:00<?, ?it/s]
{'Diff': array([0.37070938, 0.62929062]), 'Grade': array([0., 0., 1.]), 'Intel': array([0.92105263, 0.07894737]), 'Letter': array([0.99, 0.01]), 'SAT': array([0.89078947, 0.10921053])}
In [ ]:
%0A%20--%3E%0A%3C!--%20Title%3A%20pgm%20Pages%3A%201%20--%3E%0A%3Csvg%20width%3D%22306pt%22%20height%3D%22424pt%22%0A%20viewBox%3D%220.00%200.00%20306.01%20423.65%22%20xmlns%3D%22http%3A%2F%2Fwww.w3.org%2F2000%2Fsvg%22%20xmlns%3Axlink%3D%22http%3A%2F%2Fwww.w3.org%2F1999%2Fxlink%22%3E%0A%3Cg%20id%3D%22graph0%22%20class%3D%22graph%22%20transform%3D%22scale(1%201)%20rotate(0)%20translate(4%20419.6539)%22%3E%0A%3Ctitle%3Epgm%3C%2Ftitle%3E%0A%3Cpolygon%20fill%3D%22%23ffffff%22%20stroke%3D%22transparent%22%20points%3D%22-4%2C4%20-4%2C-419.6539%20302.0071%2C-419.6539%20302.0071%2C4%20-4%2C4%22%2F%3E%0A%3C!--%20Diff%20--%3E%0A%3Cg%20id%3D%22node1%22%20class%3D%22node%22%3E%0A%3Ctitle%3EDiff%3C%2Ftitle%3E%0A%3Cellipse%20fill%3D%22none%22%20stroke%3D%22%23000000%22%20cx%3D%2271.4178%22%20cy%3D%22-358.3782%22%20rx%3D%2265.5227%22%20ry%3D%2257.0522%22%2F%3E%0A%3Cpolygon%20fill%3D%22none%22%20stroke%3D%22%23000000%22%20points%3D%2236.4178%2C-370.3782%2036.4178%2C-391.3782%20107.4178%2C-391.3782%20107.4178%2C-370.3782%2036.4178%2C-370.3782%22%2F%3E%0A%3Ctext%20text-anchor%3D%22start%22%20x%3D%2256.4178%22%20y%3D%22-377.1782%22%20font-family%3D%22Times%2Cserif%22%20font-size%3D%2214.00%22%20fill%3D%22%23000000%22%3E%20Diff%20%3C%2Ftext%3E%0A%3Cpolygon%20fill%3D%22none%22%20stroke%3D%22%23000000%22%20points%3D%2236.4178%2C-347.3782%2036.4178%2C-368.3782%2070.4178%2C-368.3782%2070.4178%2C-347.3782%2036.4178%2C-347.3782%22%2F%3E%0A%3Ctext%20text-anchor%3D%22start%22%20x%3D%2239.4178%22%20y%3D%22-354.1782%22%20font-family%3D%22Times%2Cserif%22%20font-size%3D%2214.00%22%20fill%3D%22%23000000%22%3EEasy%3C%2Ftext%3E%0A%3Cpolygon%20fill%3D%22none%22%20stroke%3D%22%23000000%22%20points%3D%2272.4178%2C-347.3782%2072.4178%2C-368.3782%20107.4178%2C-368.3782%20107.4178%2C-347.3782%2072.4178%2C-347.3782%22%2F%3E%0A%3Ctext%20text-anchor%3D%22start%22%20x%3D%2275.4178%22%20y%3D%22-354.1782%22%20font-family%3D%22Times%2Cserif%22%20font-size%3D%2214.00%22%20fill%3D%22%23000000%22%3EHard%3C%2Ftext%3E%0A%3Cpolygon%20fill%3D%22none%22%20stroke%3D%22%23000000%22%20points%3D%2236.4178%2C-324.3782%2036.4178%2C-345.3782%2070.4178%2C-345.3782%2070.4178%2C-324.3782%2036.4178%2C-324.3782%22%2F%3E%0A%3Ctext%20text-anchor%3D%22start%22%20x%3D%2239.9178%22%20y%3D%22-331.1782%22%20font-family%3D%22Times%2Cserif%22%20font-size%3D%2214.00%22%20fill%3D%22%23000000%22%3E0.37%3C%2Ftext%3E%0A%3Cpolygon%20fill%3D%22none%22%20stroke%3D%22%23000000%22%20points%3D%2272.4178%2C-324.3782%2072.4178%2C-345.3782%20107.4178%2C-345.3782%20107.4178%2C-324.3782%2072.4178%2C-324.3782%22%2F%3E%0A%3Ctext%20text-anchor%3D%22start%22%20x%3D%2276.4178%22%20y%3D%22-331.1782%22%20font-family%3D%22Times%2Cserif%22%20font-size%3D%2214.00%22%20fill%3D%22%23000000%22%3E0.63%3C%2Ftext%3E%0A%3Cpolygon%20fill%3D%22none%22%20stroke%3D%22%23000000%22%20points%3D%2232.9178%2C-321.8782%2032.9178%2C-394.8782%20109.9178%2C-394.8782%20109.9178%2C-321.8782%2032.9178%2C-321.8782%22%2F%3E%0A%3C%2Fg%3E%0A%3C!--%20Grade%20--%3E%0A%3Cg%20id%3D%22node2%22%20class%3D%22node%22%3E%0A%3Ctitle%3EGrade%3C%2Ftitle%3E%0A%3Cellipse%20fill%3D%22none%22%20stroke%3D%22%23000000%22%20cx%3D%2271.4178%22%20cy%3D%22-207.8269%22%20rx%3D%2271.3357%22%20ry%3D%2257.0522%22%2F%3E%0A%3Cpolygon%20fill%3D%22%23bebebe%22%20stroke%3D%22transparent%22%20points%3D%2232.4178%2C-219.8269%2032.4178%2C-240.8269%20111.4178%2C-240.8269%20111.4178%2C-219.8269%2032.4178%2C-219.8269%22%2F%3E%0A%3Cpolygon%20fill%3D%22none%22%20stroke%3D%22%23000000%22%20points%3D%2232.4178%2C-219.8269%2032.4178%2C-240.8269%20111.4178%2C-240.8269%20111.4178%2C-219.8269%2032.4178%2C-219.8269%22%2F%3E%0A%3Ctext%20text-anchor%3D%22start%22%20x%3D%2250.4178%22%20y%3D%22-226.6269%22%20font-family%3D%22Times%2Cserif%22%20font-size%3D%2214.00%22%20fill%3D%22%23000000%22%3E%20Grade%20%3C%2Ftext%3E%0A%3Cpolygon%20fill%3D%22none%22%20stroke%3D%22%23000000%22%20points%3D%2232.4178%2C-196.8269%2032.4178%2C-217.8269%2057.4178%2C-217.8269%2057.4178%2C-196.8269%2032.4178%2C-196.8269%22%2F%3E%0A%3Ctext%20text-anchor%3D%22start%22%20x%3D%2239.4178%22%20y%3D%22-203.6269%22%20font-family%3D%22Times%2Cserif%22%20font-size%3D%2214.00%22%20fill%3D%22%23000000%22%3EA%3C%2Ftext%3E%0A%3Cpolygon%20fill%3D%22none%22%20stroke%3D%22%23000000%22%20points%3D%2259.4178%2C-196.8269%2059.4178%2C-217.8269%2084.4178%2C-217.8269%2084.4178%2C-196.8269%2059.4178%2C-196.8269%22%2F%3E%0A%3Ctext%20text-anchor%3D%22start%22%20x%3D%2266.9178%22%20y%3D%22-203.6269%22%20font-family%3D%22Times%2Cserif%22%20font-size%3D%2214.00%22%20fill%3D%22%23000000%22%3EB%3C%2Ftext%3E%0A%3Cpolygon%20fill%3D%22none%22%20stroke%3D%22%23000000%22%20points%3D%2286.4178%2C-196.8269%2086.4178%2C-217.8269%20111.4178%2C-217.8269%20111.4178%2C-196.8269%2086.4178%2C-196.8269%22%2F%3E%0A%3Ctext%20text-anchor%3D%22start%22%20x%3D%2293.9178%22%20y%3D%22-203.6269%22%20font-family%3D%22Times%2Cserif%22%20font-size%3D%2214.00%22%20fill%3D%22%23000000%22%3EC%3C%2Ftext%3E%0A%3Cpolygon%20fill%3D%22none%22%20stroke%3D%22%23000000%22%20points%3D%2232.4178%2C-173.8269%2032.4178%2C-194.8269%2057.4178%2C-194.8269%2057.4178%2C-173.8269%2032.4178%2C-173.8269%22%2F%3E%0A%3Ctext%20text-anchor%3D%22start%22%20x%3D%2235.4178%22%20y%3D%22-180.6269%22%20font-family%3D%22Times%2Cserif%22%20font-size%3D%2214.00%22%20fill%3D%22%23000000%22%3E0.0%3C%2Ftext%3E%0A%3Cpolygon%20fill%3D%22none%22%20stroke%3D%22%23000000%22%20points%3D%2259.4178%2C-173.8269%2059.4178%2C-194.8269%2084.4178%2C-194.8269%2084.4178%2C-173.8269%2059.4178%2C-173.8269%22%2F%3E%0A%3Ctext%20text-anchor%3D%22start%22%20x%3D%2262.4178%22%20y%3D%22-180.6269%22%20font-family%3D%22Times%2Cserif%22%20font-size%3D%2214.00%22%20fill%3D%22%23000000%22%3E0.0%3C%2Ftext%3E%0A%3Cpolygon%20fill%3D%22none%22%20stroke%3D%22%23000000%22%20points%3D%2286.4178%2C-173.8269%2086.4178%2C-194.8269%20111.4178%2C-194.8269%20111.4178%2C-173.8269%2086.4178%2C-173.8269%22%2F%3E%0A%3Ctext%20text-anchor%3D%22start%22%20x%3D%2289.4178%22%20y%3D%22-180.6269%22%20font-family%3D%22Times%2Cserif%22%20font-size%3D%2214.00%22%20fill%3D%22%23000000%22%3E1.0%3C%2Ftext%3E%0A%3Cpolygon%20fill%3D%22none%22%20stroke%3D%22%23000000%22%20points%3D%2228.9178%2C-171.3269%2028.9178%2C-244.3269%20113.9178%2C-244.3269%20113.9178%2C-171.3269%2028.9178%2C-171.3269%22%2F%3E%0A%3C%2Fg%3E%0A%3C!--%20Diff%26%2345%3B%26gt%3BGrade%20--%3E%0A%3Cg%20id%3D%22edge1%22%20class%3D%22edge%22%3E%0A%3Ctitle%3EDiff%26%2345%3B%26gt%3BGrade%3C%2Ftitle%3E%0A%3Cpath%20fill%3D%22none%22%20stroke%3D%22%23000000%22%20d%3D%22M71.4178%2C-301.0318C71.4178%2C-292.761%2071.4178%2C-284.1837%2071.4178%2C-275.7314%22%2F%3E%0A%3Cpolygon%20fill%3D%22%23000000%22%20stroke%3D%22%23000000%22%20points%3D%2274.9179%2C-275.5127%2071.4178%2C-265.5127%2067.9179%2C-275.5127%2074.9179%2C-275.5127%22%2F%3E%0A%3C%2Fg%3E%0A%3C!--%20Letter%20--%3E%0A%3Cg%20id%3D%22node4%22%20class%3D%22node%22%3E%0A%3Ctitle%3ELetter%3C%2Ftitle%3E%0A%3Cellipse%20fill%3D%22none%22%20stroke%3D%22%23000000%22%20cx%3D%2271.4178%22%20cy%3D%22-57.2756%22%20rx%3D%2268.6788%22%20ry%3D%2257.0522%22%2F%3E%0A%3Cpolygon%20fill%3D%22none%22%20stroke%3D%22%23000000%22%20points%3D%2234.4178%2C-69.2756%2034.4178%2C-90.2756%20109.4178%2C-90.2756%20109.4178%2C-69.2756%2034.4178%2C-69.2756%22%2F%3E%0A%3Ctext%20text-anchor%3D%22start%22%20x%3D%2251.4178%22%20y%3D%22-76.0756%22%20font-family%3D%22Times%2Cserif%22%20font-size%3D%2214.00%22%20fill%3D%22%23000000%22%3E%20Letter%20%3C%2Ftext%3E%0A%3Cpolygon%20fill%3D%22none%22%20stroke%3D%22%23000000%22%20points%3D%2234.4178%2C-46.2756%2034.4178%2C-67.2756%2067.4178%2C-67.2756%2067.4178%2C-46.2756%2034.4178%2C-46.2756%22%2F%3E%0A%3Ctext%20text-anchor%3D%22start%22%20x%3D%2238.9178%22%20y%3D%22-53.0756%22%20font-family%3D%22Times%2Cserif%22%20font-size%3D%2214.00%22%20fill%3D%22%23000000%22%3EBad%3C%2Ftext%3E%0A%3Cpolygon%20fill%3D%22none%22%20stroke%3D%22%23000000%22%20points%3D%2269.4178%2C-46.2756%2069.4178%2C-67.2756%20109.4178%2C-67.2756%20109.4178%2C-46.2756%2069.4178%2C-46.2756%22%2F%3E%0A%3Ctext%20text-anchor%3D%22start%22%20x%3D%2272.4178%22%20y%3D%22-53.0756%22%20font-family%3D%22Times%2Cserif%22%20font-size%3D%2214.00%22%20fill%3D%22%23000000%22%3EGood%3C%2Ftext%3E%0A%3Cpolygon%20fill%3D%22none%22%20stroke%3D%22%23000000%22%20points%3D%2234.4178%2C-23.2756%2034.4178%2C-44.2756%2067.4178%2C-44.2756%2067.4178%2C-23.2756%2034.4178%2C-23.2756%22%2F%3E%0A%3Ctext%20text-anchor%3D%22start%22%20x%3D%2237.4178%22%20y%3D%22-30.0756%22%20font-family%3D%22Times%2Cserif%22%20font-size%3D%2214.00%22%20fill%3D%22%23000000%22%3E0.99%3C%2Ftext%3E%0A%3Cpolygon%20fill%3D%22none%22%20stroke%3D%22%23000000%22%20points%3D%2269.4178%2C-23.2756%2069.4178%2C-44.2756%20109.4178%2C-44.2756%20109.4178%2C-23.2756%2069.4178%2C-23.2756%22%2F%3E%0A%3Ctext%20text-anchor%3D%22start%22%20x%3D%2275.9178%22%20y%3D%22-30.0756%22%20font-family%3D%22Times%2Cserif%22%20font-size%3D%2214.00%22%20fill%3D%22%23000000%22%3E0.01%3C%2Ftext%3E%0A%3Cpolygon%20fill%3D%22none%22%20stroke%3D%22%23000000%22%20points%3D%2230.9178%2C-20.7756%2030.9178%2C-93.7756%20111.9178%2C-93.7756%20111.9178%2C-20.7756%2030.9178%2C-20.7756%22%2F%3E%0A%3C%2Fg%3E%0A%3C!--%20Grade%26%2345%3B%26gt%3BLetter%20--%3E%0A%3Cg%20id%3D%22edge2%22%20class%3D%22edge%22%3E%0A%3Ctitle%3EGrade%26%2345%3B%26gt%3BLetter%3C%2Ftitle%3E%0A%3Cpath%20fill%3D%22none%22%20stroke%3D%22%23000000%22%20d%3D%22M71.4178%2C-150.4805C71.4178%2C-142.2097%2071.4178%2C-133.6324%2071.4178%2C-125.1801%22%2F%3E%0A%3Cpolygon%20fill%3D%22%23000000%22%20stroke%3D%22%23000000%22%20points%3D%2274.9179%2C-124.9614%2071.4178%2C-114.9614%2067.9179%2C-124.9614%2074.9179%2C-124.9614%22%2F%3E%0A%3C%2Fg%3E%0A%3C!--%20Intel%20--%3E%0A%3Cg%20id%3D%22node3%22%20class%3D%22node%22%3E%0A%3Ctitle%3EIntel%3C%2Ftitle%3E%0A%3Cellipse%20fill%3D%22none%22%20stroke%3D%22%23000000%22%20cx%3D%22225.4178%22%20cy%3D%22-358.3782%22%20rx%3D%2266.4361%22%20ry%3D%2257.0522%22%2F%3E%0A%3Cpolygon%20fill%3D%22none%22%20stroke%3D%22%23000000%22%20points%3D%22189.4178%2C-370.3782%20189.4178%2C-391.3782%20261.4178%2C-391.3782%20261.4178%2C-370.3782%20189.4178%2C-370.3782%22%2F%3E%0A%3Ctext%20text-anchor%3D%22start%22%20x%3D%22208.4178%22%20y%3D%22-377.1782%22%20font-family%3D%22Times%2Cserif%22%20font-size%3D%2214.00%22%20fill%3D%22%23000000%22%3E%20Intel%20%3C%2Ftext%3E%0A%3Cpolygon%20fill%3D%22none%22%20stroke%3D%22%23000000%22%20points%3D%22189.4178%2C-347.3782%20189.4178%2C-368.3782%20223.4178%2C-368.3782%20223.4178%2C-347.3782%20189.4178%2C-347.3782%22%2F%3E%0A%3Ctext%20text-anchor%3D%22start%22%20x%3D%22192.4178%22%20y%3D%22-354.1782%22%20font-family%3D%22Times%2Cserif%22%20font-size%3D%2214.00%22%20fill%3D%22%23000000%22%3ELow%3C%2Ftext%3E%0A%3Cpolygon%20fill%3D%22none%22%20stroke%3D%22%23000000%22%20points%3D%22225.4178%2C-347.3782%20225.4178%2C-368.3782%20261.4178%2C-368.3782%20261.4178%2C-347.3782%20225.4178%2C-347.3782%22%2F%3E%0A%3Ctext%20text-anchor%3D%22start%22%20x%3D%22228.4178%22%20y%3D%22-354.1782%22%20font-family%3D%22Times%2Cserif%22%20font-size%3D%2214.00%22%20fill%3D%22%23000000%22%3EHigh%3C%2Ftext%3E%0A%3Cpolygon%20fill%3D%22none%22%20stroke%3D%22%23000000%22%20points%3D%22189.4178%2C-324.3782%20189.4178%2C-345.3782%20223.4178%2C-345.3782%20223.4178%2C-324.3782%20189.4178%2C-324.3782%22%2F%3E%0A%3Ctext%20text-anchor%3D%22start%22%20x%3D%22192.9178%22%20y%3D%22-331.1782%22%20font-family%3D%22Times%2Cserif%22%20font-size%3D%2214.00%22%20fill%3D%22%23000000%22%3E0.92%3C%2Ftext%3E%0A%3Cpolygon%20fill%3D%22none%22%20stroke%3D%22%23000000%22%20points%3D%22225.4178%2C-324.3782%20225.4178%2C-345.3782%20261.4178%2C-345.3782%20261.4178%2C-324.3782%20225.4178%2C-324.3782%22%2F%3E%0A%3Ctext%20text-anchor%3D%22start%22%20x%3D%22229.9178%22%20y%3D%22-331.1782%22%20font-family%3D%22Times%2Cserif%22%20font-size%3D%2214.00%22%20fill%3D%22%23000000%22%3E0.08%3C%2Ftext%3E%0A%3Cpolygon%20fill%3D%22none%22%20stroke%3D%22%23000000%22%20points%3D%22186.4178%2C-321.8782%20186.4178%2C-394.8782%20264.4178%2C-394.8782%20264.4178%2C-321.8782%20186.4178%2C-321.8782%22%2F%3E%0A%3C%2Fg%3E%0A%3C!--%20Intel%26%2345%3B%26gt%3BGrade%20--%3E%0A%3Cg%20id%3D%22edge3%22%20class%3D%22edge%22%3E%0A%3Ctitle%3EIntel%26%2345%3B%26gt%3BGrade%3C%2Ftitle%3E%0A%3Cpath%20fill%3D%22none%22%20stroke%3D%22%23000000%22%20d%3D%22M181.2876%2C-315.2363C163.4761%2C-297.8237%20142.7759%2C-277.5871%20124.1769%2C-259.4046%22%2F%3E%0A%3Cpolygon%20fill%3D%22%23000000%22%20stroke%3D%22%23000000%22%20points%3D%22126.4904%2C-256.7716%20116.893%2C-252.2838%20121.597%2C-261.7771%20126.4904%2C-256.7716%22%2F%3E%0A%3C%2Fg%3E%0A%3C!--%20SAT%20--%3E%0A%3Cg%20id%3D%22node5%22%20class%3D%22node%22%3E%0A%3Ctitle%3ESAT%3C%2Ftitle%3E%0A%3Cellipse%20fill%3D%22none%22%20stroke%3D%22%23000000%22%20cx%3D%22229.4178%22%20cy%3D%22-207.8269%22%20rx%3D%2268.6788%22%20ry%3D%2257.0522%22%2F%3E%0A%3Cpolygon%20fill%3D%22none%22%20stroke%3D%22%23000000%22%20points%3D%22192.4178%2C-219.8269%20192.4178%2C-240.8269%20267.4178%2C-240.8269%20267.4178%2C-219.8269%20192.4178%2C-219.8269%22%2F%3E%0A%3Ctext%20text-anchor%3D%22start%22%20x%3D%22212.9178%22%20y%3D%22-226.6269%22%20font-family%3D%22Times%2Cserif%22%20font-size%3D%2214.00%22%20fill%3D%22%23000000%22%3E%20SAT%20%3C%2Ftext%3E%0A%3Cpolygon%20fill%3D%22none%22%20stroke%3D%22%23000000%22%20points%3D%22192.4178%2C-196.8269%20192.4178%2C-217.8269%20225.4178%2C-217.8269%20225.4178%2C-196.8269%20192.4178%2C-196.8269%22%2F%3E%0A%3Ctext%20text-anchor%3D%22start%22%20x%3D%22196.9178%22%20y%3D%22-203.6269%22%20font-family%3D%22Times%2Cserif%22%20font-size%3D%2214.00%22%20fill%3D%22%23000000%22%3EBad%3C%2Ftext%3E%0A%3Cpolygon%20fill%3D%22none%22%20stroke%3D%22%23000000%22%20points%3D%22227.4178%2C-196.8269%20227.4178%2C-217.8269%20267.4178%2C-217.8269%20267.4178%2C-196.8269%20227.4178%2C-196.8269%22%2F%3E%0A%3Ctext%20text-anchor%3D%22start%22%20x%3D%22230.4178%22%20y%3D%22-203.6269%22%20font-family%3D%22Times%2Cserif%22%20font-size%3D%2214.00%22%20fill%3D%22%23000000%22%3EGood%3C%2Ftext%3E%0A%3Cpolygon%20fill%3D%22none%22%20stroke%3D%22%23000000%22%20points%3D%22192.4178%2C-173.8269%20192.4178%2C-194.8269%20225.4178%2C-194.8269%20225.4178%2C-173.8269%20192.4178%2C-173.8269%22%2F%3E%0A%3Ctext%20text-anchor%3D%22start%22%20x%3D%22195.4178%22%20y%3D%22-180.6269%22%20font-family%3D%22Times%2Cserif%22%20font-size%3D%2214.00%22%20fill%3D%22%23000000%22%3E0.89%3C%2Ftext%3E%0A%3Cpolygon%20fill%3D%22none%22%20stroke%3D%22%23000000%22%20points%3D%22227.4178%2C-173.8269%20227.4178%2C-194.8269%20267.4178%2C-194.8269%20267.4178%2C-173.8269%20227.4178%2C-173.8269%22%2F%3E%0A%3Ctext%20text-anchor%3D%22start%22%20x%3D%22234.4178%22%20y%3D%22-180.6269%22%20font-family%3D%22Times%2Cserif%22%20font-size%3D%2214.00%22%20fill%3D%22%23000000%22%3E0.11%3C%2Ftext%3E%0A%3Cpolygon%20fill%3D%22none%22%20stroke%3D%22%23000000%22%20points%3D%22188.9178%2C-171.3269%20188.9178%2C-244.3269%20269.9178%2C-244.3269%20269.9178%2C-171.3269%20188.9178%2C-171.3269%22%2F%3E%0A%3C%2Fg%3E%0A%3C!--%20Intel%26%2345%3B%26gt%3BSAT%20--%3E%0A%3Cg%20id%3D%22edge4%22%20class%3D%22edge%22%3E%0A%3Ctitle%3EIntel%26%2345%3B%26gt%3BSAT%3C%2Ftitle%3E%0A%3Cpath%20fill%3D%22none%22%20stroke%3D%22%23000000%22%20d%3D%22M226.9414%2C-301.0318C227.1612%2C-292.761%20227.3891%2C-284.1837%20227.6136%2C-275.7314%22%2F%3E%0A%3Cpolygon%20fill%3D%22%23000000%22%20stroke%3D%22%23000000%22%20points%3D%22231.1182%2C-275.6022%20227.8851%2C-265.5127%20224.1207%2C-275.4162%20231.1182%2C-275.6022%22%2F%3E%0A%3C%2Fg%3E%0A%3C%2Fg%3E%0A%3C%2Fsvg%3E%0A)
'student_pgm_marginals_given_grade.pdf'
In [ ]:
0%| | 0/1 [00:00<?, ?it/s]
0%| | 0/1 [00:00<?, ?it/s]
0%| | 0/1 [00:00<?, ?it/s]
0%| | 0/1 [00:00<?, ?it/s]
0it [00:00, ?it/s]
0it [00:00, ?it/s]
{'Diff': array([0.24044002, 0.75955998]), 'Grade': array([0., 0., 1.]), 'Intel': array([0.42168675, 0.57831325]), 'Letter': array([0.99, 0.01]), 'SAT': array([0., 1.])}
%0A%20--%3E%0A%3C!--%20Title%3A%20pgm%20Pages%3A%201%20--%3E%0A%3Csvg%20width%3D%22302pt%22%20height%3D%22424pt%22%0A%20viewBox%3D%220.00%200.00%20301.89%20423.65%22%20xmlns%3D%22http%3A%2F%2Fwww.w3.org%2F2000%2Fsvg%22%20xmlns%3Axlink%3D%22http%3A%2F%2Fwww.w3.org%2F1999%2Fxlink%22%3E%0A%3Cg%20id%3D%22graph0%22%20class%3D%22graph%22%20transform%3D%22scale(1%201)%20rotate(0)%20translate(4%20419.6539)%22%3E%0A%3Ctitle%3Epgm%3C%2Ftitle%3E%0A%3Cpolygon%20fill%3D%22%23ffffff%22%20stroke%3D%22transparent%22%20points%3D%22-4%2C4%20-4%2C-419.6539%20297.8858%2C-419.6539%20297.8858%2C4%20-4%2C4%22%2F%3E%0A%3C!--%20Diff%20--%3E%0A%3Cg%20id%3D%22node1%22%20class%3D%22node%22%3E%0A%3Ctitle%3EDiff%3C%2Ftitle%3E%0A%3Cellipse%20fill%3D%22none%22%20stroke%3D%22%23000000%22%20cx%3D%2271.4178%22%20cy%3D%22-358.3782%22%20rx%3D%2265.5227%22%20ry%3D%2257.0522%22%2F%3E%0A%3Cpolygon%20fill%3D%22none%22%20stroke%3D%22%23000000%22%20points%3D%2236.4178%2C-370.3782%2036.4178%2C-391.3782%20107.4178%2C-391.3782%20107.4178%2C-370.3782%2036.4178%2C-370.3782%22%2F%3E%0A%3Ctext%20text-anchor%3D%22start%22%20x%3D%2256.4178%22%20y%3D%22-377.1782%22%20font-family%3D%22Times%2Cserif%22%20font-size%3D%2214.00%22%20fill%3D%22%23000000%22%3E%20Diff%20%3C%2Ftext%3E%0A%3Cpolygon%20fill%3D%22none%22%20stroke%3D%22%23000000%22%20points%3D%2236.4178%2C-347.3782%2036.4178%2C-368.3782%2070.4178%2C-368.3782%2070.4178%2C-347.3782%2036.4178%2C-347.3782%22%2F%3E%0A%3Ctext%20text-anchor%3D%22start%22%20x%3D%2239.4178%22%20y%3D%22-354.1782%22%20font-family%3D%22Times%2Cserif%22%20font-size%3D%2214.00%22%20fill%3D%22%23000000%22%3EEasy%3C%2Ftext%3E%0A%3Cpolygon%20fill%3D%22none%22%20stroke%3D%22%23000000%22%20points%3D%2272.4178%2C-347.3782%2072.4178%2C-368.3782%20107.4178%2C-368.3782%20107.4178%2C-347.3782%2072.4178%2C-347.3782%22%2F%3E%0A%3Ctext%20text-anchor%3D%22start%22%20x%3D%2275.4178%22%20y%3D%22-354.1782%22%20font-family%3D%22Times%2Cserif%22%20font-size%3D%2214.00%22%20fill%3D%22%23000000%22%3EHard%3C%2Ftext%3E%0A%3Cpolygon%20fill%3D%22none%22%20stroke%3D%22%23000000%22%20points%3D%2236.4178%2C-324.3782%2036.4178%2C-345.3782%2070.4178%2C-345.3782%2070.4178%2C-324.3782%2036.4178%2C-324.3782%22%2F%3E%0A%3Ctext%20text-anchor%3D%22start%22%20x%3D%2239.9178%22%20y%3D%22-331.1782%22%20font-family%3D%22Times%2Cserif%22%20font-size%3D%2214.00%22%20fill%3D%22%23000000%22%3E0.24%3C%2Ftext%3E%0A%3Cpolygon%20fill%3D%22none%22%20stroke%3D%22%23000000%22%20points%3D%2272.4178%2C-324.3782%2072.4178%2C-345.3782%20107.4178%2C-345.3782%20107.4178%2C-324.3782%2072.4178%2C-324.3782%22%2F%3E%0A%3Ctext%20text-anchor%3D%22start%22%20x%3D%2276.4178%22%20y%3D%22-331.1782%22%20font-family%3D%22Times%2Cserif%22%20font-size%3D%2214.00%22%20fill%3D%22%23000000%22%3E0.76%3C%2Ftext%3E%0A%3Cpolygon%20fill%3D%22none%22%20stroke%3D%22%23000000%22%20points%3D%2232.9178%2C-321.8782%2032.9178%2C-394.8782%20109.9178%2C-394.8782%20109.9178%2C-321.8782%2032.9178%2C-321.8782%22%2F%3E%0A%3C%2Fg%3E%0A%3C!--%20Grade%20--%3E%0A%3Cg%20id%3D%22node2%22%20class%3D%22node%22%3E%0A%3Ctitle%3EGrade%3C%2Ftitle%3E%0A%3Cellipse%20fill%3D%22none%22%20stroke%3D%22%23000000%22%20cx%3D%2271.4178%22%20cy%3D%22-207.8269%22%20rx%3D%2271.3357%22%20ry%3D%2257.0522%22%2F%3E%0A%3Cpolygon%20fill%3D%22%23bebebe%22%20stroke%3D%22transparent%22%20points%3D%2232.4178%2C-219.8269%2032.4178%2C-240.8269%20111.4178%2C-240.8269%20111.4178%2C-219.8269%2032.4178%2C-219.8269%22%2F%3E%0A%3Cpolygon%20fill%3D%22none%22%20stroke%3D%22%23000000%22%20points%3D%2232.4178%2C-219.8269%2032.4178%2C-240.8269%20111.4178%2C-240.8269%20111.4178%2C-219.8269%2032.4178%2C-219.8269%22%2F%3E%0A%3Ctext%20text-anchor%3D%22start%22%20x%3D%2250.4178%22%20y%3D%22-226.6269%22%20font-family%3D%22Times%2Cserif%22%20font-size%3D%2214.00%22%20fill%3D%22%23000000%22%3E%20Grade%20%3C%2Ftext%3E%0A%3Cpolygon%20fill%3D%22none%22%20stroke%3D%22%23000000%22%20points%3D%2232.4178%2C-196.8269%2032.4178%2C-217.8269%2057.4178%2C-217.8269%2057.4178%2C-196.8269%2032.4178%2C-196.8269%22%2F%3E%0A%3Ctext%20text-anchor%3D%22start%22%20x%3D%2239.4178%22%20y%3D%22-203.6269%22%20font-family%3D%22Times%2Cserif%22%20font-size%3D%2214.00%22%20fill%3D%22%23000000%22%3EA%3C%2Ftext%3E%0A%3Cpolygon%20fill%3D%22none%22%20stroke%3D%22%23000000%22%20points%3D%2259.4178%2C-196.8269%2059.4178%2C-217.8269%2084.4178%2C-217.8269%2084.4178%2C-196.8269%2059.4178%2C-196.8269%22%2F%3E%0A%3Ctext%20text-anchor%3D%22start%22%20x%3D%2266.9178%22%20y%3D%22-203.6269%22%20font-family%3D%22Times%2Cserif%22%20font-size%3D%2214.00%22%20fill%3D%22%23000000%22%3EB%3C%2Ftext%3E%0A%3Cpolygon%20fill%3D%22none%22%20stroke%3D%22%23000000%22%20points%3D%2286.4178%2C-196.8269%2086.4178%2C-217.8269%20111.4178%2C-217.8269%20111.4178%2C-196.8269%2086.4178%2C-196.8269%22%2F%3E%0A%3Ctext%20text-anchor%3D%22start%22%20x%3D%2293.9178%22%20y%3D%22-203.6269%22%20font-family%3D%22Times%2Cserif%22%20font-size%3D%2214.00%22%20fill%3D%22%23000000%22%3EC%3C%2Ftext%3E%0A%3Cpolygon%20fill%3D%22none%22%20stroke%3D%22%23000000%22%20points%3D%2232.4178%2C-173.8269%2032.4178%2C-194.8269%2057.4178%2C-194.8269%2057.4178%2C-173.8269%2032.4178%2C-173.8269%22%2F%3E%0A%3Ctext%20text-anchor%3D%22start%22%20x%3D%2235.4178%22%20y%3D%22-180.6269%22%20font-family%3D%22Times%2Cserif%22%20font-size%3D%2214.00%22%20fill%3D%22%23000000%22%3E0.0%3C%2Ftext%3E%0A%3Cpolygon%20fill%3D%22none%22%20stroke%3D%22%23000000%22%20points%3D%2259.4178%2C-173.8269%2059.4178%2C-194.8269%2084.4178%2C-194.8269%2084.4178%2C-173.8269%2059.4178%2C-173.8269%22%2F%3E%0A%3Ctext%20text-anchor%3D%22start%22%20x%3D%2262.4178%22%20y%3D%22-180.6269%22%20font-family%3D%22Times%2Cserif%22%20font-size%3D%2214.00%22%20fill%3D%22%23000000%22%3E0.0%3C%2Ftext%3E%0A%3Cpolygon%20fill%3D%22none%22%20stroke%3D%22%23000000%22%20points%3D%2286.4178%2C-173.8269%2086.4178%2C-194.8269%20111.4178%2C-194.8269%20111.4178%2C-173.8269%2086.4178%2C-173.8269%22%2F%3E%0A%3Ctext%20text-anchor%3D%22start%22%20x%3D%2289.4178%22%20y%3D%22-180.6269%22%20font-family%3D%22Times%2Cserif%22%20font-size%3D%2214.00%22%20fill%3D%22%23000000%22%3E1.0%3C%2Ftext%3E%0A%3Cpolygon%20fill%3D%22none%22%20stroke%3D%22%23000000%22%20points%3D%2228.9178%2C-171.3269%2028.9178%2C-244.3269%20113.9178%2C-244.3269%20113.9178%2C-171.3269%2028.9178%2C-171.3269%22%2F%3E%0A%3C%2Fg%3E%0A%3C!--%20Diff%26%2345%3B%26gt%3BGrade%20--%3E%0A%3Cg%20id%3D%22edge1%22%20class%3D%22edge%22%3E%0A%3Ctitle%3EDiff%26%2345%3B%26gt%3BGrade%3C%2Ftitle%3E%0A%3Cpath%20fill%3D%22none%22%20stroke%3D%22%23000000%22%20d%3D%22M71.4178%2C-301.0318C71.4178%2C-292.761%2071.4178%2C-284.1837%2071.4178%2C-275.7314%22%2F%3E%0A%3Cpolygon%20fill%3D%22%23000000%22%20stroke%3D%22%23000000%22%20points%3D%2274.9179%2C-275.5127%2071.4178%2C-265.5127%2067.9179%2C-275.5127%2074.9179%2C-275.5127%22%2F%3E%0A%3C%2Fg%3E%0A%3C!--%20Letter%20--%3E%0A%3Cg%20id%3D%22node4%22%20class%3D%22node%22%3E%0A%3Ctitle%3ELetter%3C%2Ftitle%3E%0A%3Cellipse%20fill%3D%22none%22%20stroke%3D%22%23000000%22%20cx%3D%2271.4178%22%20cy%3D%22-57.2756%22%20rx%3D%2268.6788%22%20ry%3D%2257.0522%22%2F%3E%0A%3Cpolygon%20fill%3D%22none%22%20stroke%3D%22%23000000%22%20points%3D%2234.4178%2C-69.2756%2034.4178%2C-90.2756%20109.4178%2C-90.2756%20109.4178%2C-69.2756%2034.4178%2C-69.2756%22%2F%3E%0A%3Ctext%20text-anchor%3D%22start%22%20x%3D%2251.4178%22%20y%3D%22-76.0756%22%20font-family%3D%22Times%2Cserif%22%20font-size%3D%2214.00%22%20fill%3D%22%23000000%22%3E%20Letter%20%3C%2Ftext%3E%0A%3Cpolygon%20fill%3D%22none%22%20stroke%3D%22%23000000%22%20points%3D%2234.4178%2C-46.2756%2034.4178%2C-67.2756%2067.4178%2C-67.2756%2067.4178%2C-46.2756%2034.4178%2C-46.2756%22%2F%3E%0A%3Ctext%20text-anchor%3D%22start%22%20x%3D%2238.9178%22%20y%3D%22-53.0756%22%20font-family%3D%22Times%2Cserif%22%20font-size%3D%2214.00%22%20fill%3D%22%23000000%22%3EBad%3C%2Ftext%3E%0A%3Cpolygon%20fill%3D%22none%22%20stroke%3D%22%23000000%22%20points%3D%2269.4178%2C-46.2756%2069.4178%2C-67.2756%20109.4178%2C-67.2756%20109.4178%2C-46.2756%2069.4178%2C-46.2756%22%2F%3E%0A%3Ctext%20text-anchor%3D%22start%22%20x%3D%2272.4178%22%20y%3D%22-53.0756%22%20font-family%3D%22Times%2Cserif%22%20font-size%3D%2214.00%22%20fill%3D%22%23000000%22%3EGood%3C%2Ftext%3E%0A%3Cpolygon%20fill%3D%22none%22%20stroke%3D%22%23000000%22%20points%3D%2234.4178%2C-23.2756%2034.4178%2C-44.2756%2067.4178%2C-44.2756%2067.4178%2C-23.2756%2034.4178%2C-23.2756%22%2F%3E%0A%3Ctext%20text-anchor%3D%22start%22%20x%3D%2237.4178%22%20y%3D%22-30.0756%22%20font-family%3D%22Times%2Cserif%22%20font-size%3D%2214.00%22%20fill%3D%22%23000000%22%3E0.99%3C%2Ftext%3E%0A%3Cpolygon%20fill%3D%22none%22%20stroke%3D%22%23000000%22%20points%3D%2269.4178%2C-23.2756%2069.4178%2C-44.2756%20109.4178%2C-44.2756%20109.4178%2C-23.2756%2069.4178%2C-23.2756%22%2F%3E%0A%3Ctext%20text-anchor%3D%22start%22%20x%3D%2275.9178%22%20y%3D%22-30.0756%22%20font-family%3D%22Times%2Cserif%22%20font-size%3D%2214.00%22%20fill%3D%22%23000000%22%3E0.01%3C%2Ftext%3E%0A%3Cpolygon%20fill%3D%22none%22%20stroke%3D%22%23000000%22%20points%3D%2230.9178%2C-20.7756%2030.9178%2C-93.7756%20111.9178%2C-93.7756%20111.9178%2C-20.7756%2030.9178%2C-20.7756%22%2F%3E%0A%3C%2Fg%3E%0A%3C!--%20Grade%26%2345%3B%26gt%3BLetter%20--%3E%0A%3Cg%20id%3D%22edge2%22%20class%3D%22edge%22%3E%0A%3Ctitle%3EGrade%26%2345%3B%26gt%3BLetter%3C%2Ftitle%3E%0A%3Cpath%20fill%3D%22none%22%20stroke%3D%22%23000000%22%20d%3D%22M71.4178%2C-150.4805C71.4178%2C-142.2097%2071.4178%2C-133.6324%2071.4178%2C-125.1801%22%2F%3E%0A%3Cpolygon%20fill%3D%22%23000000%22%20stroke%3D%22%23000000%22%20points%3D%2274.9179%2C-124.9614%2071.4178%2C-114.9614%2067.9179%2C-124.9614%2074.9179%2C-124.9614%22%2F%3E%0A%3C%2Fg%3E%0A%3C!--%20Intel%20--%3E%0A%3Cg%20id%3D%22node3%22%20class%3D%22node%22%3E%0A%3Ctitle%3EIntel%3C%2Ftitle%3E%0A%3Cellipse%20fill%3D%22none%22%20stroke%3D%22%23000000%22%20cx%3D%22224.4178%22%20cy%3D%22-358.3782%22%20rx%3D%2266.4361%22%20ry%3D%2257.0522%22%2F%3E%0A%3Cpolygon%20fill%3D%22none%22%20stroke%3D%22%23000000%22%20points%3D%22188.4178%2C-370.3782%20188.4178%2C-391.3782%20260.4178%2C-391.3782%20260.4178%2C-370.3782%20188.4178%2C-370.3782%22%2F%3E%0A%3Ctext%20text-anchor%3D%22start%22%20x%3D%22207.4178%22%20y%3D%22-377.1782%22%20font-family%3D%22Times%2Cserif%22%20font-size%3D%2214.00%22%20fill%3D%22%23000000%22%3E%20Intel%20%3C%2Ftext%3E%0A%3Cpolygon%20fill%3D%22none%22%20stroke%3D%22%23000000%22%20points%3D%22188.4178%2C-347.3782%20188.4178%2C-368.3782%20222.4178%2C-368.3782%20222.4178%2C-347.3782%20188.4178%2C-347.3782%22%2F%3E%0A%3Ctext%20text-anchor%3D%22start%22%20x%3D%22191.4178%22%20y%3D%22-354.1782%22%20font-family%3D%22Times%2Cserif%22%20font-size%3D%2214.00%22%20fill%3D%22%23000000%22%3ELow%3C%2Ftext%3E%0A%3Cpolygon%20fill%3D%22none%22%20stroke%3D%22%23000000%22%20points%3D%22224.4178%2C-347.3782%20224.4178%2C-368.3782%20260.4178%2C-368.3782%20260.4178%2C-347.3782%20224.4178%2C-347.3782%22%2F%3E%0A%3Ctext%20text-anchor%3D%22start%22%20x%3D%22227.4178%22%20y%3D%22-354.1782%22%20font-family%3D%22Times%2Cserif%22%20font-size%3D%2214.00%22%20fill%3D%22%23000000%22%3EHigh%3C%2Ftext%3E%0A%3Cpolygon%20fill%3D%22none%22%20stroke%3D%22%23000000%22%20points%3D%22188.4178%2C-324.3782%20188.4178%2C-345.3782%20222.4178%2C-345.3782%20222.4178%2C-324.3782%20188.4178%2C-324.3782%22%2F%3E%0A%3Ctext%20text-anchor%3D%22start%22%20x%3D%22191.9178%22%20y%3D%22-331.1782%22%20font-family%3D%22Times%2Cserif%22%20font-size%3D%2214.00%22%20fill%3D%22%23000000%22%3E0.42%3C%2Ftext%3E%0A%3Cpolygon%20fill%3D%22none%22%20stroke%3D%22%23000000%22%20points%3D%22224.4178%2C-324.3782%20224.4178%2C-345.3782%20260.4178%2C-345.3782%20260.4178%2C-324.3782%20224.4178%2C-324.3782%22%2F%3E%0A%3Ctext%20text-anchor%3D%22start%22%20x%3D%22228.9178%22%20y%3D%22-331.1782%22%20font-family%3D%22Times%2Cserif%22%20font-size%3D%2214.00%22%20fill%3D%22%23000000%22%3E0.58%3C%2Ftext%3E%0A%3Cpolygon%20fill%3D%22none%22%20stroke%3D%22%23000000%22%20points%3D%22185.4178%2C-321.8782%20185.4178%2C-394.8782%20263.4178%2C-394.8782%20263.4178%2C-321.8782%20185.4178%2C-321.8782%22%2F%3E%0A%3C%2Fg%3E%0A%3C!--%20Intel%26%2345%3B%26gt%3BGrade%20--%3E%0A%3Cg%20id%3D%22edge3%22%20class%3D%22edge%22%3E%0A%3Ctitle%3EIntel%26%2345%3B%26gt%3BGrade%3C%2Ftitle%3E%0A%3Cpath%20fill%3D%22none%22%20stroke%3D%22%23000000%22%20d%3D%22M180.5741%2C-315.2363C162.8783%2C-297.8237%20142.3125%2C-277.5871%20123.8343%2C-259.4046%22%2F%3E%0A%3Cpolygon%20fill%3D%22%23000000%22%20stroke%3D%22%23000000%22%20points%3D%22126.1805%2C-256.8029%20116.5977%2C-252.2838%20121.2708%2C-261.7924%20126.1805%2C-256.8029%22%2F%3E%0A%3C%2Fg%3E%0A%3C!--%20SAT%20--%3E%0A%3Cg%20id%3D%22node5%22%20class%3D%22node%22%3E%0A%3Ctitle%3ESAT%3C%2Ftitle%3E%0A%3Cellipse%20fill%3D%22none%22%20stroke%3D%22%23000000%22%20cx%3D%22227.4178%22%20cy%3D%22-207.8269%22%20rx%3D%2266.4361%22%20ry%3D%2257.0522%22%2F%3E%0A%3Cpolygon%20fill%3D%22%23bebebe%22%20stroke%3D%22transparent%22%20points%3D%22191.4178%2C-219.8269%20191.4178%2C-240.8269%20263.4178%2C-240.8269%20263.4178%2C-219.8269%20191.4178%2C-219.8269%22%2F%3E%0A%3Cpolygon%20fill%3D%22none%22%20stroke%3D%22%23000000%22%20points%3D%22191.4178%2C-219.8269%20191.4178%2C-240.8269%20263.4178%2C-240.8269%20263.4178%2C-219.8269%20191.4178%2C-219.8269%22%2F%3E%0A%3Ctext%20text-anchor%3D%22start%22%20x%3D%22210.4178%22%20y%3D%22-226.6269%22%20font-family%3D%22Times%2Cserif%22%20font-size%3D%2214.00%22%20fill%3D%22%23000000%22%3E%20SAT%20%3C%2Ftext%3E%0A%3Cpolygon%20fill%3D%22none%22%20stroke%3D%22%23000000%22%20points%3D%22191.4178%2C-196.8269%20191.4178%2C-217.8269%20221.4178%2C-217.8269%20221.4178%2C-196.8269%20191.4178%2C-196.8269%22%2F%3E%0A%3Ctext%20text-anchor%3D%22start%22%20x%3D%22194.4178%22%20y%3D%22-203.6269%22%20font-family%3D%22Times%2Cserif%22%20font-size%3D%2214.00%22%20fill%3D%22%23000000%22%3EBad%3C%2Ftext%3E%0A%3Cpolygon%20fill%3D%22none%22%20stroke%3D%22%23000000%22%20points%3D%22223.4178%2C-196.8269%20223.4178%2C-217.8269%20263.4178%2C-217.8269%20263.4178%2C-196.8269%20223.4178%2C-196.8269%22%2F%3E%0A%3Ctext%20text-anchor%3D%22start%22%20x%3D%22226.4178%22%20y%3D%22-203.6269%22%20font-family%3D%22Times%2Cserif%22%20font-size%3D%2214.00%22%20fill%3D%22%23000000%22%3EGood%3C%2Ftext%3E%0A%3Cpolygon%20fill%3D%22none%22%20stroke%3D%22%23000000%22%20points%3D%22191.4178%2C-173.8269%20191.4178%2C-194.8269%20221.4178%2C-194.8269%20221.4178%2C-173.8269%20191.4178%2C-173.8269%22%2F%3E%0A%3Ctext%20text-anchor%3D%22start%22%20x%3D%22196.9178%22%20y%3D%22-180.6269%22%20font-family%3D%22Times%2Cserif%22%20font-size%3D%2214.00%22%20fill%3D%22%23000000%22%3E0.0%3C%2Ftext%3E%0A%3Cpolygon%20fill%3D%22none%22%20stroke%3D%22%23000000%22%20points%3D%22223.4178%2C-173.8269%20223.4178%2C-194.8269%20263.4178%2C-194.8269%20263.4178%2C-173.8269%20223.4178%2C-173.8269%22%2F%3E%0A%3Ctext%20text-anchor%3D%22start%22%20x%3D%22233.9178%22%20y%3D%22-180.6269%22%20font-family%3D%22Times%2Cserif%22%20font-size%3D%2214.00%22%20fill%3D%22%23000000%22%3E1.0%3C%2Ftext%3E%0A%3Cpolygon%20fill%3D%22none%22%20stroke%3D%22%23000000%22%20points%3D%22188.4178%2C-171.3269%20188.4178%2C-244.3269%20266.4178%2C-244.3269%20266.4178%2C-171.3269%20188.4178%2C-171.3269%22%2F%3E%0A%3C%2Fg%3E%0A%3C!--%20Intel%26%2345%3B%26gt%3BSAT%20--%3E%0A%3Cg%20id%3D%22edge4%22%20class%3D%22edge%22%3E%0A%3Ctitle%3EIntel%26%2345%3B%26gt%3BSAT%3C%2Ftitle%3E%0A%3Cpath%20fill%3D%22none%22%20stroke%3D%22%23000000%22%20d%3D%22M225.5605%2C-301.0318C225.7253%2C-292.761%20225.8962%2C-284.1837%20226.0647%2C-275.7314%22%2F%3E%0A%3Cpolygon%20fill%3D%22%23000000%22%20stroke%3D%22%23000000%22%20points%3D%22229.5683%2C-275.5805%20226.2683%2C-265.5127%20222.5697%2C-275.4409%20229.5683%2C-275.5805%22%2F%3E%0A%3C%2Fg%3E%0A%3C%2Fg%3E%0A%3C%2Fsvg%3E%0A)
'student_pgm_marginals_given_grade_sat.pdf'
In [ ]:
In [ ]: