Book a Demo!
CoCalc Logo Icon
StoreFeaturesDocsShareSupportNewsAboutPoliciesSign UpSign In
tensorflow
GitHub Repository: tensorflow/docs-l10n
Path: blob/master/site/ko/hub/tutorials/movinet.ipynb
25118 views
Kernel: Python 3

Licensed under the Apache License, Version 2.0 (the "License");

# Copyright 2021 The TensorFlow Hub Authors. All Rights Reserved. # # Licensed under the Apache License, Version 2.0 (the "License"); # you may not use this file except in compliance with the License. # You may obtain a copy of the License at # # http://www.apache.org/licenses/LICENSE-2.0 # # Unless required by applicable law or agreed to in writing, software # distributed under the License is distributed on an "AS IS" BASIS, # WITHOUT WARRANTIES OR CONDITIONS OF ANY KIND, either express or implied. # See the License for the specific language governing permissions and # limitations under the License. # ==============================================================================

스트리밍 동작 인식을 위한 MoViNet

이 튜토리얼에서는 사전 학습된 비디오 분류 모델을 사용하여 주어진 비디오에서 활동(예: 춤, 수영, 자전거 타기 등)을 분류하는 방법을 보여줍니다.

이 튜토리얼에서 사용된 모델 아키텍처는 MoViNet(Mobile Video Networks)이라고 합니다. MoVieNets는 거대한 데이터세트(Kinetics 600)에서 훈련된 효율적인 비디오 분류 모델 집합입니다.

TF Hub에서 사용 가능한 i3d 모델과 달리 MoViNet은 스트리밍 비디오에서 프레임별 추론도 지원합니다.

사전 훈련된 모델은 TF Hub에서 사용할 수 있습니다. TF Hub 컬렉션에는 TFLite에 최적화된 양자화된 모델도 포함되어 있습니다.

이러한 모델의 소스는 TensorFlow Model Garden에서 제공합니다. 여기에는 MoViNet 모델 구축 및 미세 조정에 대한 내용도 담긴 이 튜토리얼의 상세 버전이 포함됩니다.

이 MoViNet 튜토리얼은 TensorFlow 비디오 튜토리얼 시리즈의 일부입니다. 다른 세 개의 튜토리얼은 다음과 같습니다.

  • 비디오 데이터 로드: 이 튜토리얼에서는 처음부터 비디오 데이터를 TensorFlow 데이터세트 파이프라인으로 로드하고 전처리하는 방법을 설명합니다.

  • 비디오 분류를 위한 3D CNN 모델 구축: 이 튜토리얼에서는 3D 데이터의 공간적 및 시간적 측면을 분해하는 (2+1)D CNN을 사용합니다. MRI 스캔과 같은 체적 데이터를 사용하는 경우 (2+1)D CNN 대신 3D CNN을 사용하는 것이 좋습니다.

  • MoViNet을 사용한 비디오 분류 전이 학습: 이 튜토리얼에서는 UCF-101 데이터세트와 함께 상이한 데이터세트에서 훈련된 사전 훈련 비디오 분류 모델을 사용하는 방법에 대해 설명합니다.

jumping jacks plot

설정

더 작은 모델(A0-A2)에 대한 추론의 경우, 이 Colab에 대한 CPU가 충분합니다.

!sudo apt install -y ffmpeg !pip install -q mediapy
!pip uninstall -q -y opencv-python-headless !pip install -q "opencv-python-headless<4.3"
# Import libraries import pathlib import matplotlib as mpl import matplotlib.pyplot as plt import mediapy as media import numpy as np import PIL import tensorflow as tf import tensorflow_hub as hub import tqdm mpl.rcParams.update({ 'font.size': 10, })

kinetics 600 레이블 목록을 가져오고 처음 몇 개의 레이블을 인쇄합니다.

labels_path = tf.keras.utils.get_file( fname='labels.txt', origin='https://raw.githubusercontent.com/tensorflow/models/f8af2291cced43fc9f1d9b41ddbf772ae7b0d7d2/official/projects/movinet/files/kinetics_600_labels.txt' ) labels_path = pathlib.Path(labels_path) lines = labels_path.read_text().splitlines() KINETICS_600_LABELS = np.array([line.strip() for line in lines]) KINETICS_600_LABELS[:20]

분류를 위한 간단한 예제 비디오를 제공하기 위해 팔 벌려 뛰기를 수행 중인 짧은 gif를 로드할 수 있습니다.

jumping jacks

저작자 표시: CC-BY 라이선스에 따라 Coach Bobby Bluford가 YouTube에서 공유한 영상입니다.

gif를 다운로드합니다.

jumpingjack_url = 'https://github.com/tensorflow/models/raw/f8af2291cced43fc9f1d9b41ddbf772ae7b0d7d2/official/projects/movinet/files/jumpingjack.gif' jumpingjack_path = tf.keras.utils.get_file( fname='jumpingjack.gif', origin=jumpingjack_url, cache_dir='.', cache_subdir='.', )

gif 파일을 tf.Tensor로 읽는 함수를 정의합니다.

#@title # Read and process a video def load_gif(file_path, image_size=(224, 224)): """Loads a gif file into a TF tensor. Use images resized to match what's expected by your model. The model pages say the "A2" models expect 224 x 224 images at 5 fps Args: file_path: path to the location of a gif file. image_size: a tuple of target size. Returns: a video of the gif file """ # Load a gif file, convert it to a TF tensor raw = tf.io.read_file(file_path) video = tf.io.decode_gif(raw) # Resize the video video = tf.image.resize(video, image_size) # change dtype to a float32 # Hub models always want images normalized to [0,1] # ref: https://www.tensorflow.org/hub/common_signatures/images#input video = tf.cast(video, tf.float32) / 255. return video

비디오의 형상은 (frames, height, width, colors)입니다.

jumpingjack=load_gif(jumpingjack_path) jumpingjack.shape

모델을 사용하는 방법

이 섹션에는 TensorFlow Hub의 모델을 사용하는 방법을 보여주는 연습이 포함되어 있습니다. 작동 중인 모델만 보고 싶다면 다음 섹션으로 건너뛰세요.

각 모델에는 basestreaming의 두 가지 버전이 있습니다.

  • base 버전은 비디오를 입력으로 사용하고 프레임에 대한 평균 확률을 반환합니다.

  • streaming 버전은 비디오 프레임과 RNN 상태를 입력으로 사용하고 해당 프레임과 새 RNN 상태에 대한 예측을 반환합니다.

기본 모델

%%time id = 'a2' mode = 'base' version = '3' hub_url = f'https://tfhub.dev/tensorflow/movinet/{id}/{mode}/kinetics-600/classification/{version}' model = hub.load(hub_url)

이 버전의 모델에는 하나의 signature가 있습니다. 형상이 (batch, frames, height, width, colors)tf.float32image 인수를 취합니다. 그리고 하나의 출력, 즉 형상이 (batch, classes)인 로짓의 tf.float32 텐서를 포함하는 사전을 반환합니다.

sig = model.signatures['serving_default'] print(sig.pretty_printed_signature())

비디오에서 이 서명을 실행하려면 먼저 비디오에 외부 batch 차원을 추가해야 합니다.

#warmup sig(image = jumpingjack[tf.newaxis, :1]);
%%time logits = sig(image = jumpingjack[tf.newaxis, ...]) logits = logits['classifier_head'][0] print(logits.shape) print()

위의 출력 처리를 나중에 패키징하는 get_top_k 함수를 정의합니다.

#@title # Get top_k labels and probabilities def get_top_k(probs, k=5, label_map=KINETICS_600_LABELS): """Outputs the top k model labels and probabilities on the given video. Args: probs: probability tensor of shape (num_frames, num_classes) that represents the probability of each class on each frame. k: the number of top predictions to select. label_map: a list of labels to map logit indices to label strings. Returns: a tuple of the top-k labels and probabilities. """ # Sort predictions to find top_k top_predictions = tf.argsort(probs, axis=-1, direction='DESCENDING')[:k] # collect the labels of top_k predictions top_labels = tf.gather(label_map, top_predictions, axis=-1) # decode lablels top_labels = [label.decode('utf8') for label in top_labels.numpy()] # top_k probabilities of the predictions top_probs = tf.gather(probs, top_predictions, axis=-1).numpy() return tuple(zip(top_labels, top_probs))

logits을 확률로 변환하고 비디오의 상위 5개 클래스를 찾습니다. 모델은 비디오가 jumping jacks일 가능성이 있음을 확인합니다.

probs = tf.nn.softmax(logits, axis=-1) for label, p in get_top_k(probs): print(f'{label:20s}: {p:.3f}')

스트리밍 모델

이전 섹션에서는 전체 비디오를 실행하는 모델을 사용했습니다. 종종 비디오를 처리할 때 마지막에 하나의 예측을 원하지 않고 프레임별로 예측을 업데이트하고 싶을 수 있습니다. 모델의 stream 버전을 사용하면 가능합니다.

모델의 stream 버전을 로드합니다.

%%time id = 'a2' mode = 'stream' version = '3' hub_url = f'https://tfhub.dev/tensorflow/movinet/{id}/{mode}/kinetics-600/classification/{version}' model = hub.load(hub_url)

이 모델을 사용하는 것은 base 모델보다 약간 더 복잡합니다. 모델의 RNN에 대한 내부 상태를 추적해야 합니다.

list(model.signatures.keys())

init_states 서명은 비디오의 형상 (batch, frames, height, width, colors)를 입력으로 사용하고 초기 RNN 상태를 포함하는 텐서의 방대한 사전을 반환합니다.

lines = model.signatures['init_states'].pretty_printed_signature().splitlines() lines = lines[:10] lines.append(' ...') print('.\n'.join(lines))
initial_state = model.init_states(jumpingjack[tf.newaxis, ...].shape)
type(initial_state)
list(sorted(initial_state.keys()))[:5]

RNN의 초기 상태가 확보되면 상태와 비디오 프레임을 입력으로 전달할 수 있습니다(비디오 프레임의 (batch, frames, height, width, colors) 형상 유지). 모델은 (logits, state) 쌍을 반환합니다.

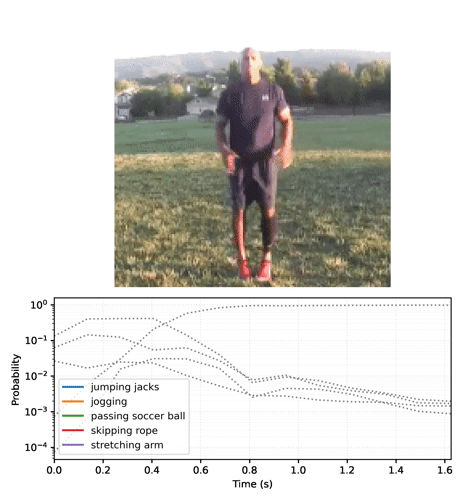
첫 번째 프레임을 본 후 모델은 비디오가 "팔 벌려 뛰기"인지 확신하지 못합니다.

inputs = initial_state.copy() # Add the batch axis, take the first frme, but keep the frame-axis. inputs['image'] = jumpingjack[tf.newaxis, 0:1, ...]
# warmup model(inputs);
logits, new_state = model(inputs) logits = logits[0] probs = tf.nn.softmax(logits, axis=-1) for label, p in get_top_k(probs): print(f'{label:20s}: {p:.3f}') print()

루프에서 모델을 실행하여 각 프레임과 함께 업데이트된 상태를 전달하면 모델이 올바른 결과로 빠르게 수렴됩니다.

%%time state = initial_state.copy() all_logits = [] for n in range(len(jumpingjack)): inputs = state inputs['image'] = jumpingjack[tf.newaxis, n:n+1, ...] result, state = model(inputs) all_logits.append(logits) probabilities = tf.nn.softmax(all_logits, axis=-1)
for label, p in get_top_k(probabilities[-1]): print(f'{label:20s}: {p:.3f}')
id = tf.argmax(probabilities[-1]) plt.plot(probabilities[:, id]) plt.xlabel('Frame #') plt.ylabel(f"p('{KINETICS_600_LABELS[id]}')");

base 모델을 실행한 이전 섹션보다 최종 확률이 훨씬 더 확실하다는 것을 알 수 있습니다. base 모델은 전체 프레임에 대한 예측의 평균을 반환합니다.

for label, p in get_top_k(tf.reduce_mean(probabilities, axis=0)): print(f'{label:20s}: {p:.3f}')

시간 경과에 따른 예측 애니메이션

이전 섹션에서는 이러한 모델을 사용하는 방법에 대해 자세히 설명했습니다. 이 섹션은 이를 바탕으로 멋진 추론 애니메이션을 생성합니다.

아래의 숨겨진 셀은 이 섹션에서 사용되는 도우미 함수를 정의합니다.

#@title # Get top_k labels and probabilities predicted using MoViNets streaming model def get_top_k_streaming_labels(probs, k=5, label_map=KINETICS_600_LABELS): """Returns the top-k labels over an entire video sequence. Args: probs: probability tensor of shape (num_frames, num_classes) that represents the probability of each class on each frame. k: the number of top predictions to select. label_map: a list of labels to map logit indices to label strings. Returns: a tuple of the top-k probabilities, labels, and logit indices """ top_categories_last = tf.argsort(probs, -1, 'DESCENDING')[-1, :1] # Sort predictions to find top_k categories = tf.argsort(probs, -1, 'DESCENDING')[:, :k] categories = tf.reshape(categories, [-1]) counts = sorted([ (i.numpy(), tf.reduce_sum(tf.cast(categories == i, tf.int32)).numpy()) for i in tf.unique(categories)[0] ], key=lambda x: x[1], reverse=True) top_probs_idx = tf.constant([i for i, _ in counts[:k]]) top_probs_idx = tf.concat([top_categories_last, top_probs_idx], 0) # find unique indices of categories top_probs_idx = tf.unique(top_probs_idx)[0][:k+1] # top_k probabilities of the predictions top_probs = tf.gather(probs, top_probs_idx, axis=-1) top_probs = tf.transpose(top_probs, perm=(1, 0)) # collect the labels of top_k predictions top_labels = tf.gather(label_map, top_probs_idx, axis=0) # decode the top_k labels top_labels = [label.decode('utf8') for label in top_labels.numpy()] return top_probs, top_labels, top_probs_idx # Plot top_k predictions at a given time step def plot_streaming_top_preds_at_step( top_probs, top_labels, step=None, image=None, legend_loc='lower left', duration_seconds=10, figure_height=500, playhead_scale=0.8, grid_alpha=0.3): """Generates a plot of the top video model predictions at a given time step. Args: top_probs: a tensor of shape (k, num_frames) representing the top-k probabilities over all frames. top_labels: a list of length k that represents the top-k label strings. step: the current time step in the range [0, num_frames]. image: the image frame to display at the current time step. legend_loc: the placement location of the legend. duration_seconds: the total duration of the video. figure_height: the output figure height. playhead_scale: scale value for the playhead. grid_alpha: alpha value for the gridlines. Returns: A tuple of the output numpy image, figure, and axes. """ # find number of top_k labels and frames in the video num_labels, num_frames = top_probs.shape if step is None: step = num_frames # Visualize frames and top_k probabilities of streaming video fig = plt.figure(figsize=(6.5, 7), dpi=300) gs = mpl.gridspec.GridSpec(8, 1) ax2 = plt.subplot(gs[:-3, :]) ax = plt.subplot(gs[-3:, :]) # display the frame if image is not None: ax2.imshow(image, interpolation='nearest') ax2.axis('off') # x-axis (frame number) preview_line_x = tf.linspace(0., duration_seconds, num_frames) # y-axis (top_k probabilities) preview_line_y = top_probs line_x = preview_line_x[:step+1] line_y = preview_line_y[:, :step+1] for i in range(num_labels): ax.plot(preview_line_x, preview_line_y[i], label=None, linewidth='1.5', linestyle=':', color='gray') ax.plot(line_x, line_y[i], label=top_labels[i], linewidth='2.0') ax.grid(which='major', linestyle=':', linewidth='1.0', alpha=grid_alpha) ax.grid(which='minor', linestyle=':', linewidth='0.5', alpha=grid_alpha) min_height = tf.reduce_min(top_probs) * playhead_scale max_height = tf.reduce_max(top_probs) ax.vlines(preview_line_x[step], min_height, max_height, colors='red') ax.scatter(preview_line_x[step], max_height, color='red') ax.legend(loc=legend_loc) plt.xlim(0, duration_seconds) plt.ylabel('Probability') plt.xlabel('Time (s)') plt.yscale('log') fig.tight_layout() fig.canvas.draw() data = np.frombuffer(fig.canvas.tostring_rgb(), dtype=np.uint8) data = data.reshape(fig.canvas.get_width_height()[::-1] + (3,)) plt.close() figure_width = int(figure_height * data.shape[1] / data.shape[0]) image = PIL.Image.fromarray(data).resize([figure_width, figure_height]) image = np.array(image) return image # Plotting top_k predictions from MoViNets streaming model def plot_streaming_top_preds( probs, video, top_k=5, video_fps=25., figure_height=500, use_progbar=True): """Generates a video plot of the top video model predictions. Args: probs: probability tensor of shape (num_frames, num_classes) that represents the probability of each class on each frame. video: the video to display in the plot. top_k: the number of top predictions to select. video_fps: the input video fps. figure_fps: the output video fps. figure_height: the height of the output video. use_progbar: display a progress bar. Returns: A numpy array representing the output video. """ # select number of frames per second video_fps = 8. # select height of the image figure_height = 500 # number of time steps of the given video steps = video.shape[0] # estimate duration of the video (in seconds) duration = steps / video_fps # estiamte top_k probabilities and corresponding labels top_probs, top_labels, _ = get_top_k_streaming_labels(probs, k=top_k) images = [] step_generator = tqdm.trange(steps) if use_progbar else range(steps) for i in step_generator: image = plot_streaming_top_preds_at_step( top_probs=top_probs, top_labels=top_labels, step=i, image=video[i], duration_seconds=duration, figure_height=figure_height, ) images.append(image) return np.array(images)

비디오 프레임에서 스트리밍 모델을 실행하고 로짓을 수집하여 시작합니다.

init_states = model.init_states(jumpingjack[tf.newaxis].shape)
# Insert your video clip here video = jumpingjack images = tf.split(video[tf.newaxis], video.shape[0], axis=1) all_logits = [] # To run on a video, pass in one frame at a time states = init_states for image in tqdm.tqdm(images): # predictions for each frame logits, states = model({**states, 'image': image}) all_logits.append(logits) # concatinating all the logits logits = tf.concat(all_logits, 0) # estimating probabilities probs = tf.nn.softmax(logits, axis=-1)
final_probs = probs[-1] print('Top_k predictions and their probablities\n') for label, p in get_top_k(final_probs): print(f'{label:20s}: {p:.3f}')

확률 시퀀스를 비디오로 변환합니다.

# Generate a plot and output to a video tensor plot_video = plot_streaming_top_preds(probs, video, video_fps=8.)
# For gif format, set codec='gif' media.show_video(plot_video, fps=3)

리소스

사전 훈련된 모델은 TF Hub에서 사용할 수 있습니다. TF Hub 컬렉션에는 TFLite에 최적화된 양자화된 모델도 포함되어 있습니다.

이러한 모델의 소스는 TensorFlow Model Garden에서 제공합니다. 여기에는 MoViNet 모델 구축 및 미세 조정에 대한 내용도 담긴 이 튜토리얼의 상세 버전이 포함됩니다.

다음 단계

TensorFlow에서 비디오 데이터 작업에 대해 자세히 알아보려면 다음 튜토리얼을 확인하세요.