1
0.527169811320755
0.341035625019815
0.999999999999998
2
1-sample proportions test with continuity correction
data: 284 out of 631, null probability 0.5
X-squared = 6.0919, df = 1, p-value = 0.01358
alternative hypothesis: true p is not equal to 0.5
95 percent confidence interval:
0.4108988 0.4898761
sample estimates:
p
0.4500792
3
One Sample t-test
data: x
t = 11.254, df = 52, p-value = 1.506e-15
alternative hypothesis: true mean is not equal to 0
90 percent confidence interval:
0.4487193 0.6056204
sample estimates:
mean of x
0.5271698
4
One Sample t-test
data: x
t = 15.563, df = 26, p-value = 1.085e-14
alternative hypothesis: true mean is not equal to 0
95 percent confidence interval:
87.24226 113.79478
sample estimates:
mean of x
100.5185
5
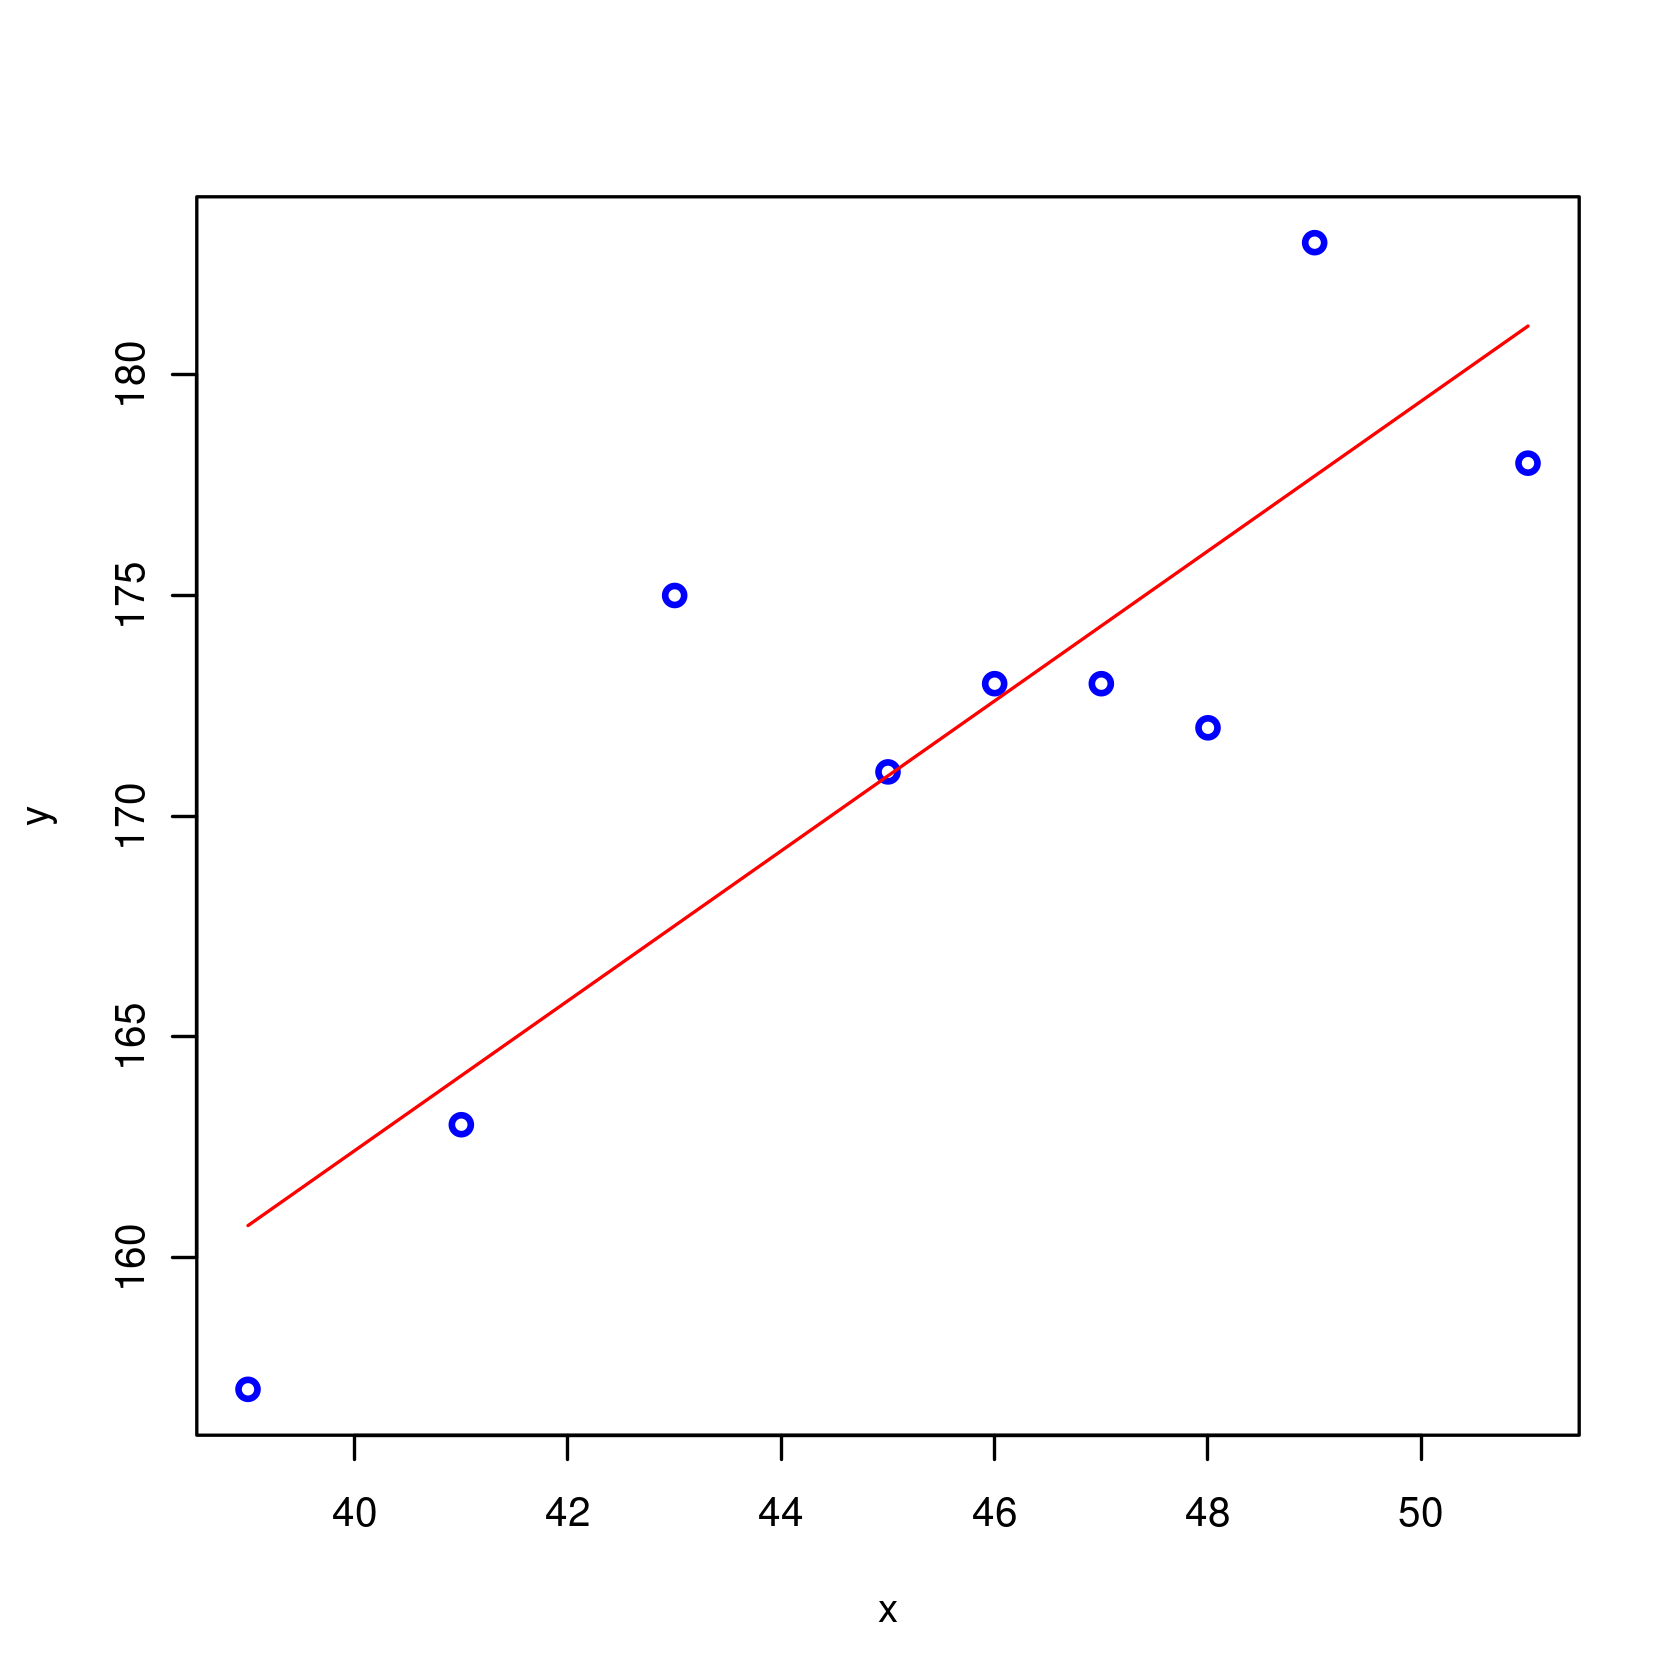
[1] 1.69963
'a = 94.43'
'b = 1.70'
6
0.855968284268897
'coeff. of determination r^2=0.7327'