Call:
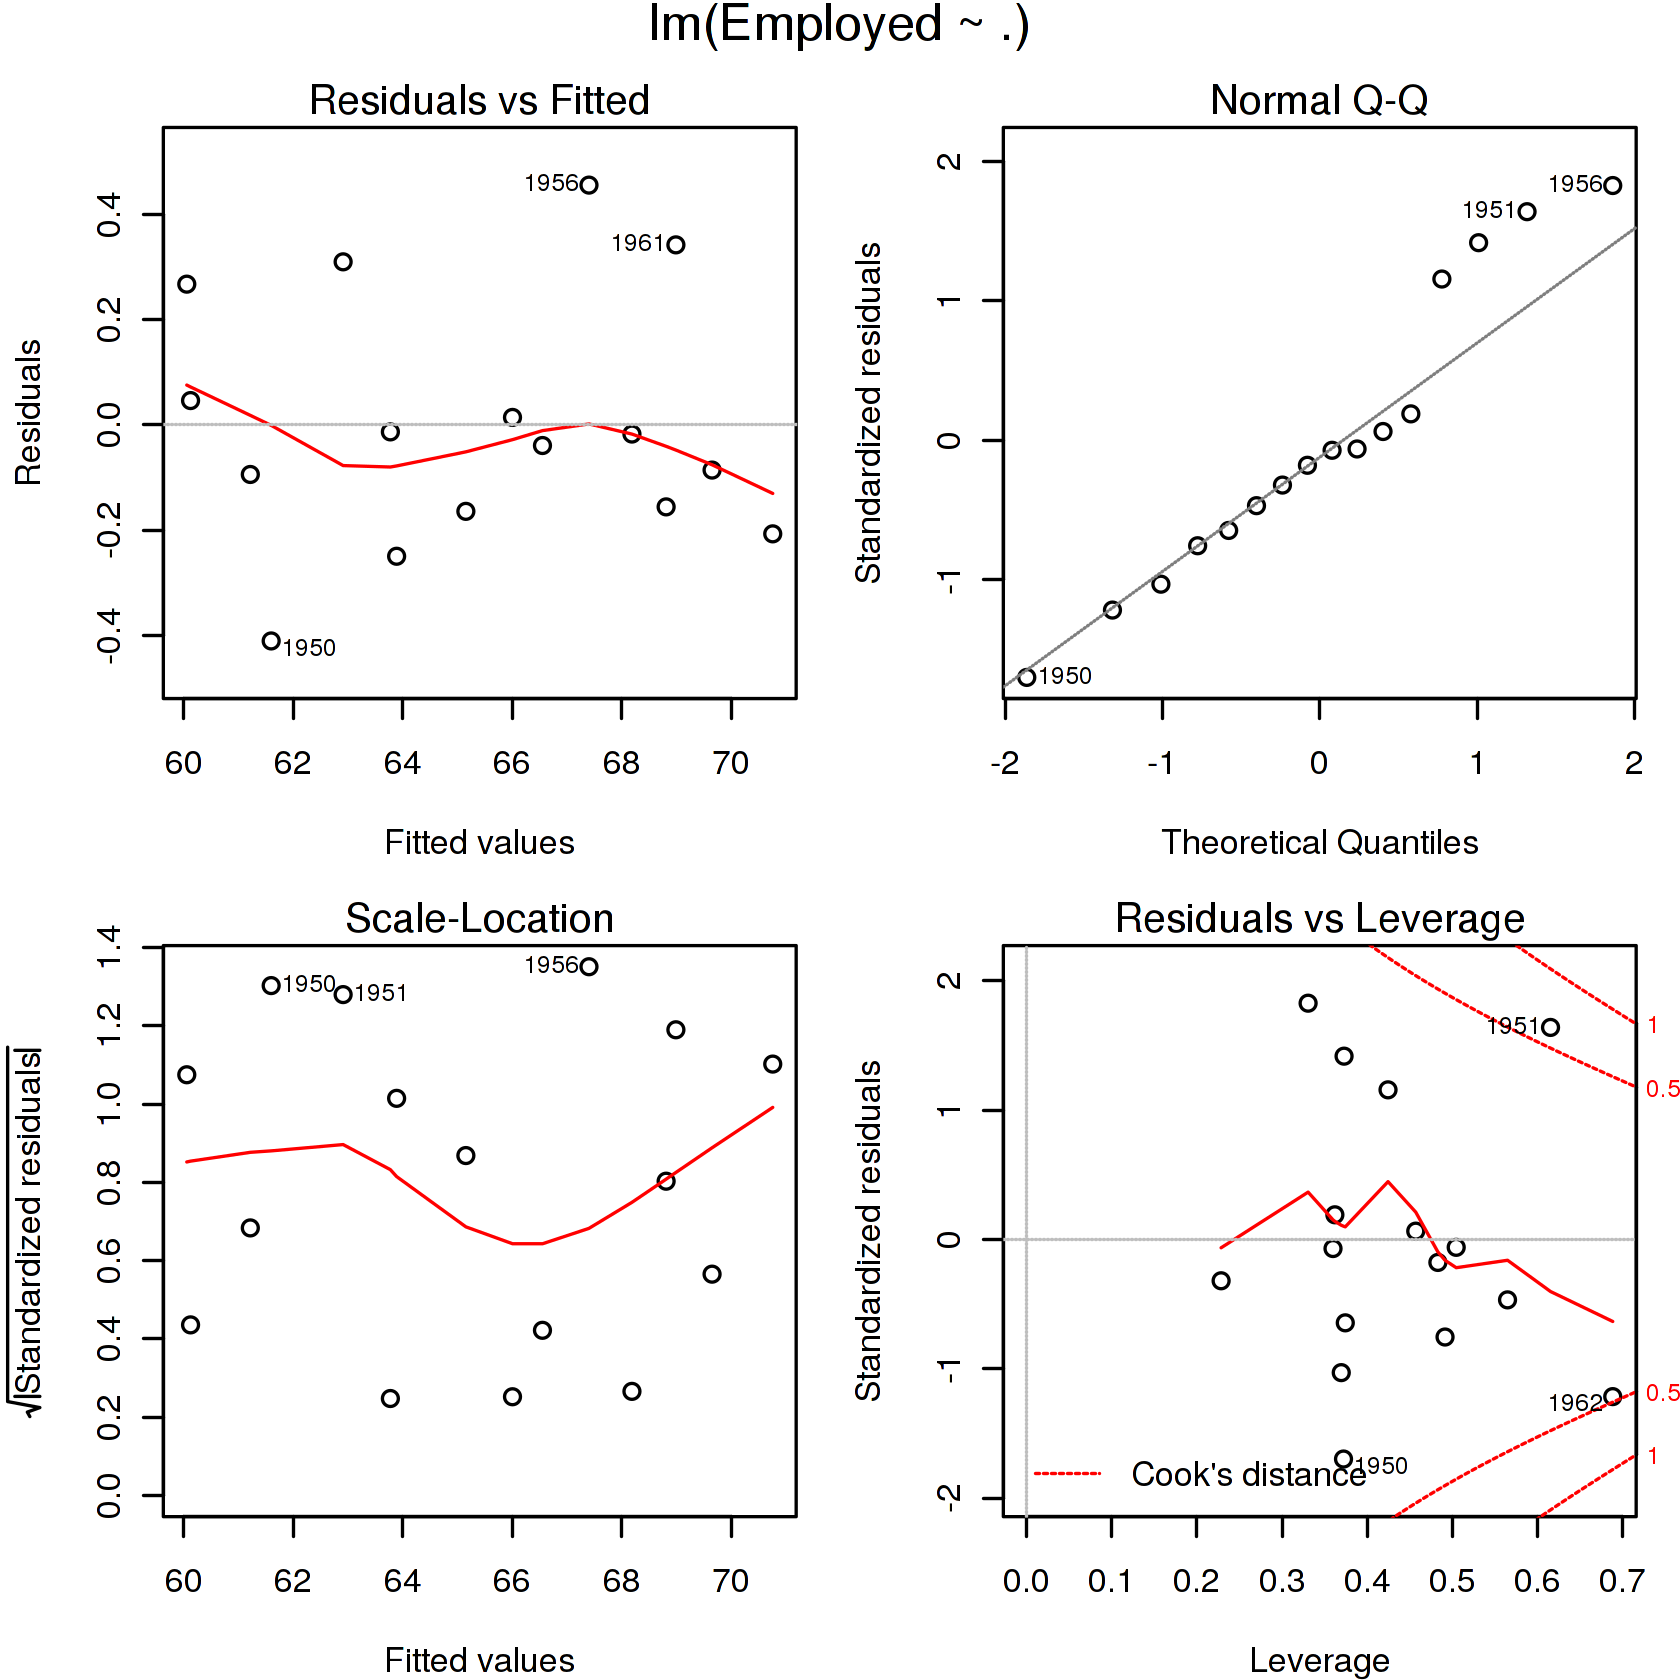
lm(formula = Employed ~ ., data = longley)
Residuals:
Min 1Q Median 3Q Max
-0.41011 -0.15767 -0.02816 0.10155 0.45539
Coefficients:
Estimate Std. Error t value Pr(>|t|)
(Intercept) -3.482e+03 8.904e+02 -3.911 0.003560 **
GNP.deflator 1.506e-02 8.492e-02 0.177 0.863141
GNP -3.582e-02 3.349e-02 -1.070 0.312681
Unemployed -2.020e-02 4.884e-03 -4.136 0.002535 **
Armed.Forces -1.033e-02 2.143e-03 -4.822 0.000944 ***
Population -5.110e-02 2.261e-01 -0.226 0.826212
Year 1.829e+00 4.555e-01 4.016 0.003037 **
---
Signif. codes: 0 ‘***’ 0.001 ‘**’ 0.01 ‘*’ 0.05 ‘.’ 0.1 ‘ ’ 1
Residual standard error: 0.3049 on 9 degrees of freedom
Multiple R-squared: 0.9955, Adjusted R-squared: 0.9925
F-statistic: 330.3 on 6 and 9 DF, p-value: 4.984e-10