Using Machine Learning in an HR Diagram
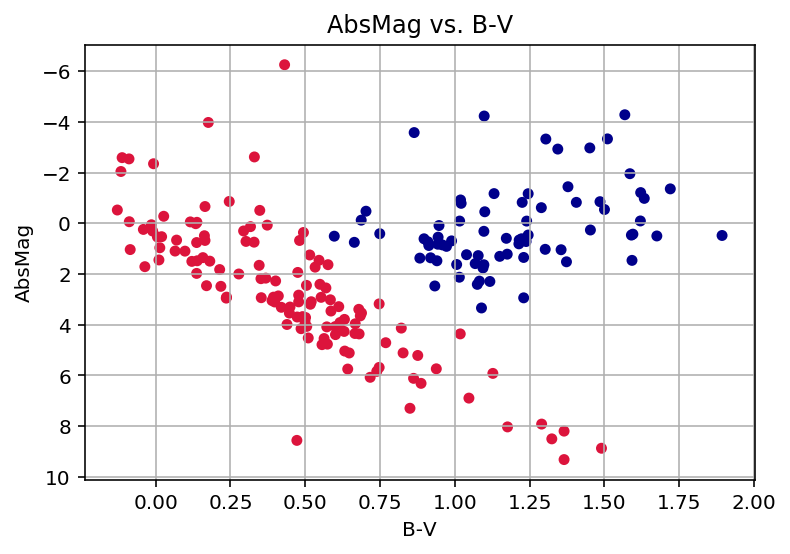
This worksheet is a quick exploration of clustering of unlabeled data to classify stars in a Herzsprung-Russell Diagram (HRD) for a sample set of stars.
In this simple test, two clusters of stars are identified. I think a more sophisticated approach is needed for the other customary groups.
Clustering code is from the scikit-learn Python package.
References
Introduction to HRD: The Hertzsprung-Russell Diagram
Sloan Digital Sky Survey DR14 Projects: The Hertzsprung-Russell Diagram
scikit-learn documentation: Clustering
Hubble Space Telescope: Hertzsprung-Russell diagram animation
number of columns 26
(113942, 5)
Hpmag -1.087600
Plx 379.210000
B-V 0.009000
Distance 2.637061
AbsMag 1.806799
Name: 32349, dtype: float64
(200, 5)