OS3307 (Modeling Practices for Computing)
Lesson 1: Introduction to Statistics with Python
Author: Michelle L. Isenhour
Last Updated: Fall 2018
References:
Section 2.1 (pp. 5 - 17), An Introduction to Statistics with Python (2016) by Thomas Haslwanter.
"Python for Data Analysis" (October 2016) by Andrew Tedstone http://chris35wills.github.io/courses/pydata_stack/
Python Package Index by Python Software Foundation https://pypi.org
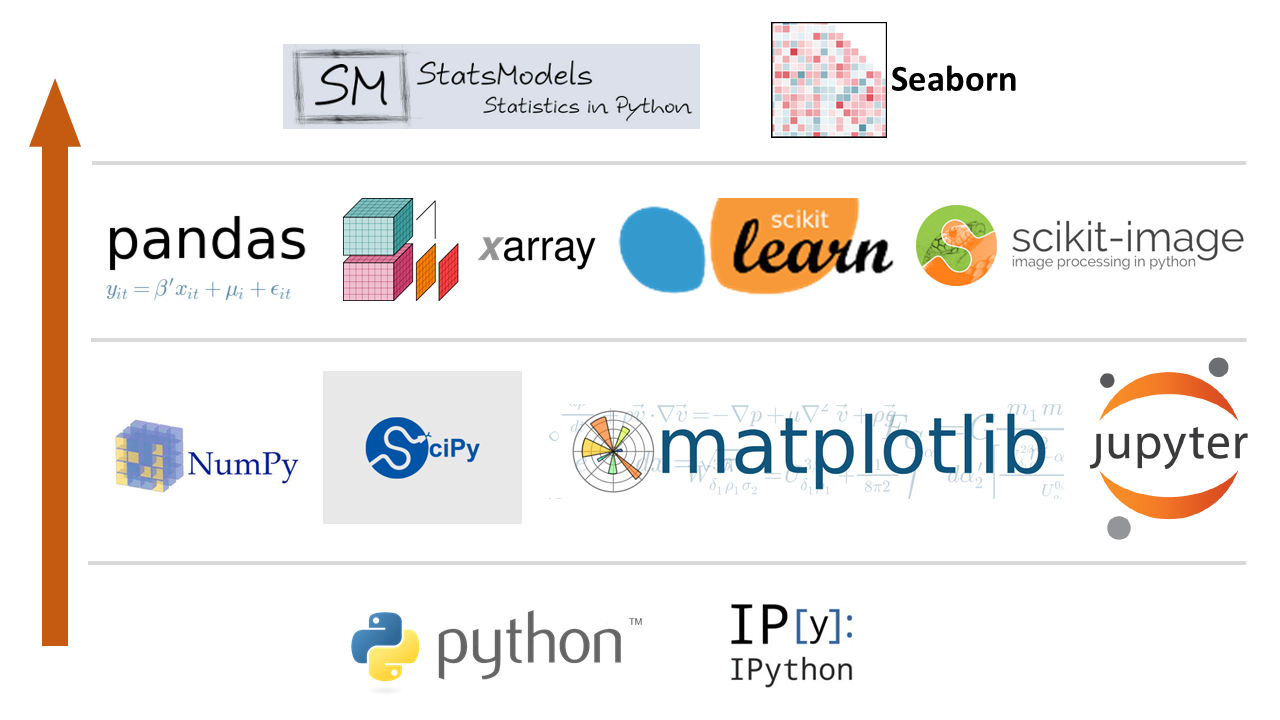
Python Packages for Statistics

Foundational Packages
Python (Python 3.7.0): a very popular open source programming language. The core distribution contains only the essential features of a general programming language. In order to conduct statistical analysis, we will need to explicitly load several additional packages.
To manually find the current version of Python, open a new command window and type:
python --version
IPython (ipython 6.5.0): the computational kernel running the Python commands. Provides the tools for interactive data analysis. Allows you to quickly display graphs and change directories, explore the workspace, and provides a command history.
To manually find the current version of IPython, open a new command window and type:
ipython --version
To manually upgrade to the current version of IPython, type:
pip install --upgrade ipython
PyPI: The Python Package Index
The Python Package Index (PyPI) is a repository of software for the Python programming language. Individual packages from PyPI can be installed easily from the Windows command shell (cmd) or the terminal window:
pip install [_package_]
To update a package:
pip install --upgrade [_package_]
To get a list of all Python packages on your computer:
pip list
Anaconda Navigator
Anaconda (Anaconda Navigator 1.8.7) is a package manager, and environment manager, a Python distribution, and a collection of over 1,000 most-commonly used open source packages. Anaconda uses conda (conda 4.5.11) , a more powerful installation manager; however, pip also works from the command prompt with Anaconda.
To update Anaconda, read this first: https://stackoverflow.com/questions/45197777/how-do-i-update-anaconda
Basic Building Blocks
NumPy (numpy 1.15.1): the most important package for scientific applications which makes working with vectors and matrices fast and efficient. Provides N-dimensional numerical arrays and vectors, linear algebra, Fourier transforms.
SciPy (scipy 1.1.0): builds closely on NumPy, providing more advanced numerical methods, integration, ordinary differential equation (ODE) solvers. For the statistical data analysis,
script.statscontains the algorithms for basic statistics.Matplotlib (matplotlib 2.2.3): Python’s main graphing/plotting library. The documentation on the Matplotlib website is good, especially the gallery.
JuPyter (jupyter 1.0.0): rather than using the interactive IPython command line, during class we will use Python in a ‘notebook’ style from inside the web browser. This keeps the commands and their outputs together in a single document that you can reference later on.
Analyzing and Manipulating Data
Pandas (pandas 0.23.4): provides fast, flexible, and expressive data structures (called DataFrames) designed to make working with structured (tabular, multidimensional, potentially heterogeneous) and time series data both easy and intuitive. It aims to be the fundamental high-level building block for doing practical, real world data analysis in Python.
patsy (patsy 0.5.0): for describing statistical models (especially linear models, or models that have a linear component) and building design matrices. Brings the convenience of R "formulas" to Python.
xlrd (xlrd 1.1.0): extracts data from MS Excel spreadsheets on any platform.
PyMC (pymc 2.3.6): for Bayesian statistics, including Markov chain Monte Carlo simulations.
scikit-learn (scikit-learn 0.19.2): machine learning tools for Python. Increasingly popular, contains all the main algorithms used in this field such as K-means clustering.
scikits.bootstrap (scikits.bootstrap 1.0.0): provides bootstrap confidence interval algorithms for SciPy.
scikit-image (scikit-image 0.14.0): a bunch of functionality for doing image analysis, including satellite images.
lifelines (lifelines 0.14.6): survival analysis in Python.
xarray (xarray 0.10.8): brings the labeled data power of Pandas to the physical sciences, by providing N-dimensional variants of the core Pandas data structures. Provides a pandas-like and pandas-compatible toolkit for analytics on multi-dimensional arrays.
Advanced Statistics
Statsmodels (statsmodels 0.9.0): provides implementations of all the major statistical algorithms. Preferentially works with Pandas DataFrames. Has the option of using R-like syntax, which you’ll probably like if you’re familiar with R.
seaborn (seaborn 0.9.0): a set of statistical plotting tools which extends the plotting abilities of matplotlib. The plots look very elegant. Well worth looking at if you do a lot of statistical work. Takes Pandas DataFrames as standard.
Other Application-Dependent Packages
SPy (spectral 0.19): for processing hyperspectral image data (imaging spectroscopy data). It has functions for reading, displaying, manipulating, and classifying hyperspectral imagery.
AstroPy (astropy 3.0.4): contains core functionality and some common tools needed for performing astronomy and astrophysics research with Python.
PyTables (tables 3.4.4): or managing hierarchical datasets and designed to efficently cope with extremely large amounts of data (note Pandas does this pretty well for the most part).
Bokeh (bokeh 0.13.0): for interactive plotting
CartoPy (cartopy 0.16.0): for geographic plotting. Requires install of Proj4 4.9.3
Matplotlib basemap (basemap 1.0.7): An add-on toolkit for matplotlib that lets you plot data on map projections with coastlines, lakes, rivers and political boundaries. See http://matplotlib.github.com/basemap/users/examples.html for examples of what it can do.
GDAL (gdal 2.3.1) and OGR: geographic transformations and warping. Fantastic and the gold standard if you can get it to work, expect a bit of a fight but well worth it.
PySAL (PySAL 1.14.4.post2): Spatial Analysis Library. Particularly good at spatial econometrics, location modelling...
Python Tips
Packages should be imported with their commonly used names:
import numpy as np
import matplotlib.pyplot as plt
import scipy as sp
import pandas as pd
import seaborn as sns
Lesson Summary
Python and IPython provide the foundation for conducting Statistical Analysis in Python.
The basic building blocks consists of the JuPyter, NumPy, SciPy, and Matplotlib packages.
Pandas enables the use of Series (1-dimensional) and DataFrames (2-dimensional) to conduct statistical analysis.
Statsmodels and Seaborn provide advanced statistical modeling, analysis, and visualization capabilities in Python.
Python packages for statistics can be managed using the package manager in Anaconda (preferred) or through the use of the Python Package Index (PyPi).