Starting with the right-half plane, this map doubles all the angles (and stretches the lengths as necessary). In effect it wraps the right-half plane around the negative x axis.
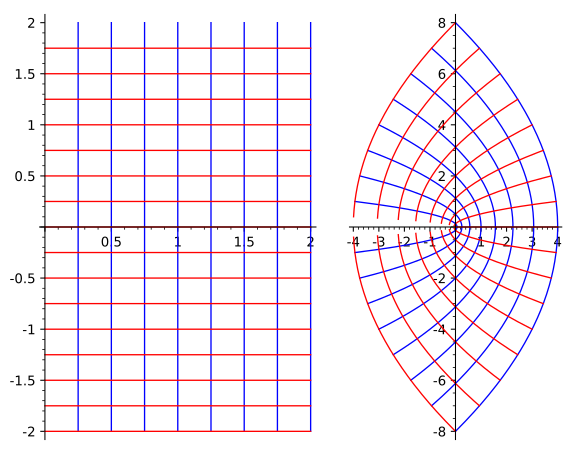
This is the inverse of the squaring function so it has the opposite effect. Starting with the left-half plane, make a slit along the negative -axis, then shrink all the angles by half. This opens up the slit, rotating the top edge of the slit up to the positive -axis, and rotating the bottom side of the slit down to the negative -axis and bending the part in-between so that it all fits.
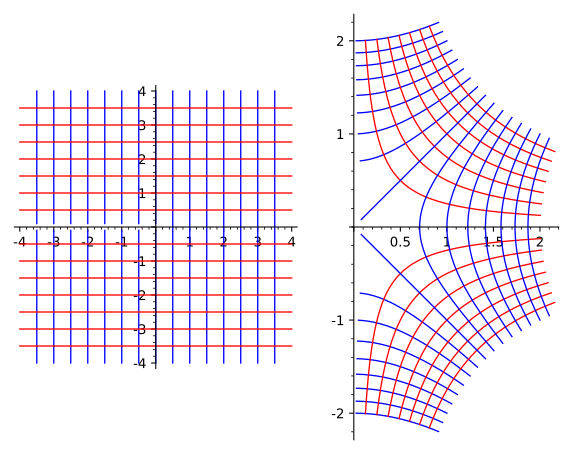
Exponential map
This wraps *the entire plane* around and around and around and covering everything except the origin. Each vertical strip , where , wraps once around, bending and stretching so that it covers the entire plane except the origin. The effect is to cover the entire plane except the origin over and over. The picture shows a small part of this.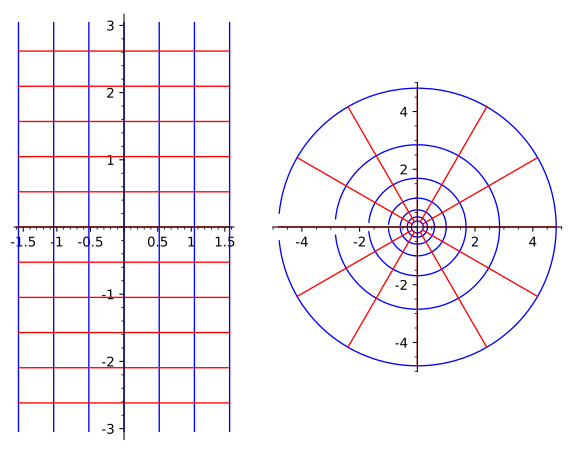
For this map we'll use polar coordinates. As the radius goes to infinity, gets close to . That's the reason why the red lines wrap around toward on the image graph.
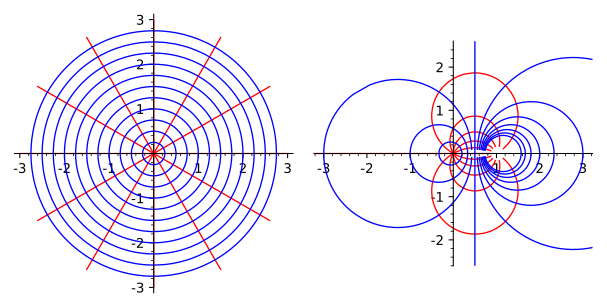
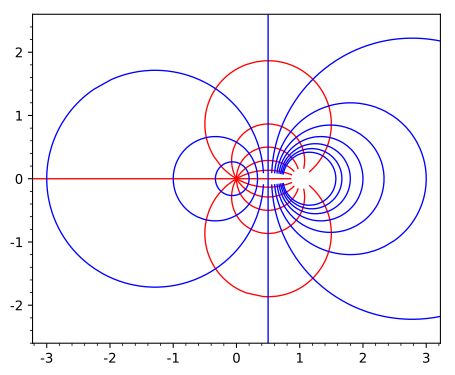
The axes obscure part of the image. Here's a plot of the image with the axes removed.
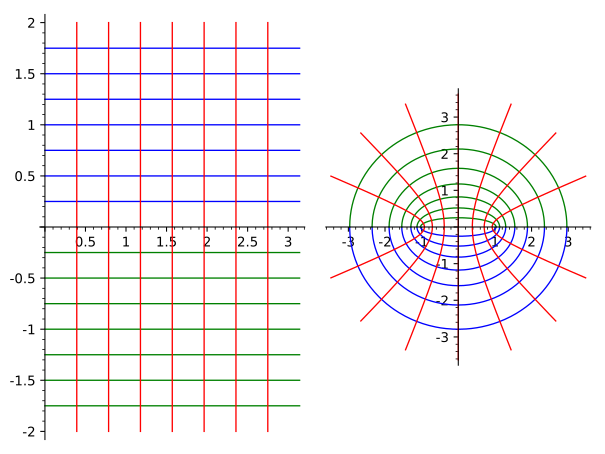
As increases along the blue and green horizontal lines in the domain the corresponding ellipse in the range is traced out in the clockwise direction. As increases on the vertical red lines in the domain, the corresponding point in the range travels down the corresponding hyperbola.